Bulls are entering the market as the New Zealand dollar against the US dollar rises at 0.62102, mainly due to the decline in the value of the US dollar.
…
This is a premium post.
[s2If !current_user_can(access_s2member_level4)]Please register for FREE REGISTER to read full post below containing analysis. In case of any error or you think you are not able to read the full post below, please email us at support#nehcap.com [lwa][/s2If] [s2If current_user_can(access_s2member_level1)]
- NZD/USD bulls move in as the Greenback sells-off.
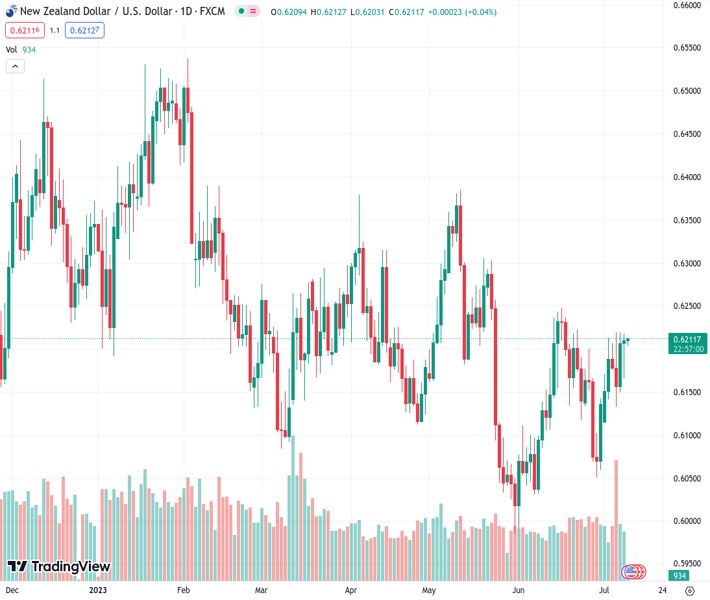
The pair currently trades last at 0.62102.
The previous day high was 0.6221 while the previous day low was 0.6153. The daily 38.2% Fib levels comes at 0.6195, expected to provide support. Similarly, the daily 61.8% fib level is at 0.6179, expected to provide support.
NZD/USD is trading near 0.6210 on Tuesday as Asia opens for business. The pair was giving two-way moves at the start of the week following a run higher as the Greenback sold off, sending the Kiwi off its lows near 0.6170 to a high near 0.6220.
The US Dollar fell by -0.31% and posted a 2-week low as lower Treasury-note yields dropped in a technical move from highs and weighed on the Greenback. In addition, weaker-than-expected US economic news on May wholesale sales and May consumer credit was negative for the US Dollar ahead of this week’s Consumer Price Index inflation data.
”Core prices likely decelerated in June to their slowest m/m pace since 2021, with the index rising 0.2% MoM (0.23% ungrounded),’ ‘analysts at TD Securities said:
”Goods inflation were likely a big factor, with shelter prices remaining the key wildcard (we expect modest slowing). Recovering gas prices will also help to keep headline inflation steady. Our MoM forecasts imply 3.1%/4.9% YoY for total/core prices.”
Domestically, there was not much to go by so far, but data from China showed a very different price dynamic to that of New Zealand, where wage-price spiral risks are expected to keep policymakers worried for a while yet, analysts at ANZ Bank explained:
”China’s headline CPI came in at 0.0% y/y in June (mkt: +0.2%), while the PPI declined 5.4% y/y (mkt: -5.0%), suggesting China’s post-COVID rebound has run out of steam, and adding to expectations that policymakers may need to do more to shore up demand. In the interim, however, a weakening demand pulse in China represents a further downside risk to New Zealand’s export prices and the recovery in tourist arrivals from China (which are yet to pick up meaningfully), and that’s adding to the risk of a wider for longer NZ current account deficit.”
”The silver lining,” the analysts said, ”is that China’s slowdown is having a negative influence on global goods inflation, which is helping to drive headline inflation rates down across many economies (including New Zealand). However, the Reserve Bank of New Zealand’s main battle lies with the relatively sticky domestic (non-tradables) inflation, which is still running at more than double the pace it should be.”
”Regardless of global factors, the RBNZ cannot be confident they have tackled too-high inflation until domestic economic conditions (chiefly the labour market) are better balanced. A weaker China may help with that somewhat (eg via lower investment and labour demand than otherwise), but there’s still plenty of NZ fiscal stimulus to lean against in the near term, and a renewed upwards momentum developing in a number of forward-looking indicators, such as our Business Outlook.”
Technical Levels: Supports and Resistances
NZDUSD currently trading at 0.6211 at the time of writing. Pair opened at 0.6199 and is trading with a change of 0.19 % .
| Overview | Overview.1 | |
|---|---|---|
| 0 | Today last price | 0.6211 |
| 1 | Today Daily Change | 0.0012 |
| 2 | Today Daily Change % | 0.1900 |
| 3 | Today daily open | 0.6199 |
The pair remains strongly bullish on the daily timeframe. It trades above its 20 SMA @ 0.6163, 50 SMA 0.6169, 100 SMA @ 0.6189 and 200 SMA @ 0.6175.
| Trends | Trends.1 | |
|---|---|---|
| 0 | Daily SMA20 | 0.6163 |
| 1 | Daily SMA50 | 0.6169 |
| 2 | Daily SMA100 | 0.6189 |
| 3 | Daily SMA200 | 0.6175 |
The previous day high was 0.6221 while the previous day low was 0.6153. The daily 38.2% Fib levels comes at 0.6195, expected to provide support. Similarly, the daily 61.8% fib level is at 0.6179, expected to provide support.
Note the levels of interest below:
- Pivot support is noted at 0.6161, 0.6123, 0.6093
- Pivot resistance is noted at 0.6229, 0.6259, 0.6297
| Levels | Levels.1 |
|---|---|
| Previous Daily High | 0.6221 |
| Previous Daily Low | 0.6153 |
| Previous Weekly High | 0.6221 |
| Previous Weekly Low | 0.6124 |
| Previous Monthly High | 0.6250 |
| Previous Monthly Low | 0.5990 |
| Daily Fibonacci 38.2% | 0.6195 |
| Daily Fibonacci 61.8% | 0.6179 |
| Daily Pivot Point S1 | 0.6161 |
| Daily Pivot Point S2 | 0.6123 |
| Daily Pivot Point S3 | 0.6093 |
| Daily Pivot Point R1 | 0.6229 |
| Daily Pivot Point R2 | 0.6259 |
| Daily Pivot Point R3 | 0.6297 |
[/s2If]
Download Nehcap EAWe have two EAs that are operational on our LIVE accounts.
- EA-FIX: Check out the details here. Download EA-FIX . EA-FIX is a non-grid HFT scalper.
- EA-GROWTH: High quality low dd EA using trend grids. Download EA_GROWTHJoin Our Telegram Group
")


