#XAUUSD @ 1,917.25 Gold price has failed to sustain above $1,920.00 amid a hawkish interest rate outlook from the Fed.
…
This is a premium post.
[s2If !current_user_can(access_s2member_level4)]Please register for FREE REGISTER to read full post below containing analysis. In case of any error or you think you are not able to read the full post below, please email us at support#nehcap.com [lwa][/s2If] [s2If current_user_can(access_s2member_level1)]
- Gold price has failed to sustain above $1,920.00 amid a hawkish interest rate outlook from the Fed.
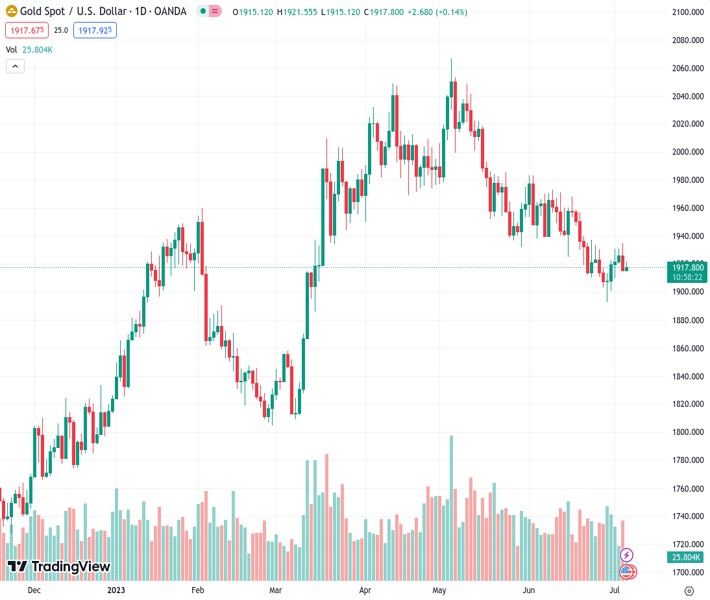
The pair currently trades last at 1917.25.
The previous day high was 1935.09 while the previous day low was 1914.84. The daily 38.2% Fib levels comes at 1922.58, expected to provide resistance. Similarly, the daily 61.8% fib level is at 1927.35, expected to provide resistance.
Gold price (XAU/USD) has sensed selling pressure while attempting to sustain above the crucial resistance of $1,920.00 in the European session. The precious metal is struggling to attract bets as Federal Reserve (Fed) policymakers remained hawkish on interest rate outlook, according to Federal Open Market Committee (FOMC) minutes.
Despite deepening worries about the economic outlook due to tight credit conditions, Fed policymakers are in support of more restricting monetary policy as inflation is still stubborn due to robust demand.
S&P500 futures have posted meaningful losses in Europe as investors are cautious ahead of Employment data and quarterly result season. On Thursday, investors will focus on the Automatic Data Processing (ADP) Employment Change report. As per the estimates, the US ADP report will show fresh additions of 228K in June vs. the former addition of 278K.
In addition to the ADP Employment report, US ISM Services PMI will also be on the radar. The economic data is seen higher at 51.0 vs. the former release of 50.3. While New Orders Index is seen declining to 53.3 against the prior release of 56.2.
Meanwhile, the US Dollar Index (DXY) is expected to turn sideways as investors have sidelined ahead of key economic indicators. However, the 10-year US Treasury yields have climbed to 3.97%.
Gold price has faced severe selling pressure while attempting to surpass the 100-period Exponential Moving Average (EMA) plotted around $1,929.00. The precious metal failed to sustain above the downward-sloping trendline plotted from May 03 high at $2,079.76.
The Relative Strength Index (RSI) (14) is oscillating in the 40.00-60.00. Bearish momentum would trigger if it drops below 60.00.
Technical Levels: Supports and Resistances
XAUUSD currently trading at 1919.2 at the time of writing. Pair opened at 1915.41 and is trading with a change of 0.2 % .
| Overview | Overview.1 | |
|---|---|---|
| 0 | Today last price | 1919.20 |
| 1 | Today Daily Change | 3.79 |
| 2 | Today Daily Change % | 0.20 |
| 3 | Today daily open | 1915.41 |
The pair is trading below its 20 Daily moving average @ 1933.75, below its 50 Daily moving average @ 1964.83 , below its 100 Daily moving average @ 1946.38 and above its 200 Daily moving average @ 1863.76
| Trends | Trends.1 | |
|---|---|---|
| 0 | Daily SMA20 | 1933.75 |
| 1 | Daily SMA50 | 1964.83 |
| 2 | Daily SMA100 | 1946.38 |
| 3 | Daily SMA200 | 1863.76 |
The previous day high was 1935.09 while the previous day low was 1914.84. The daily 38.2% Fib levels comes at 1922.58, expected to provide resistance. Similarly, the daily 61.8% fib level is at 1927.35, expected to provide resistance.
Note the levels of interest below:
- Pivot support is noted at 1908.47, 1901.53, 1888.22
- Pivot resistance is noted at 1928.72, 1942.03, 1948.97
| Levels | Levels.1 |
|---|---|
| Previous Daily High | 1935.09 |
| Previous Daily Low | 1914.84 |
| Previous Weekly High | 1933.39 |
| Previous Weekly Low | 1893.01 |
| Previous Monthly High | 1983.50 |
| Previous Monthly Low | 1893.01 |
| Daily Fibonacci 38.2% | 1922.58 |
| Daily Fibonacci 61.8% | 1927.35 |
| Daily Pivot Point S1 | 1908.47 |
| Daily Pivot Point S2 | 1901.53 |
| Daily Pivot Point S3 | 1888.22 |
| Daily Pivot Point R1 | 1928.72 |
| Daily Pivot Point R2 | 1942.03 |
| Daily Pivot Point R3 | 1948.97 |
[/s2If]
Nehcap Expert Advisor
The NEHCAP MT4 EA is high quality professional trading system geared to generate returns without using GRID or martingales. Each trade has strict risk per trade parameter. The pairs under management include EURUSD, GBPUSD, AUDCAD, AUDNZD,GBPAUD, EURAUD, EURCAD, CHFJPY and many more.
The system is trading live: LIVE ACCOUNT TRACKING
You can run it free. Apply for a free trial and track our account. Buy the system or use profit share mechanism to generate returns on your MT4.
Join Our Telegram Group
")


