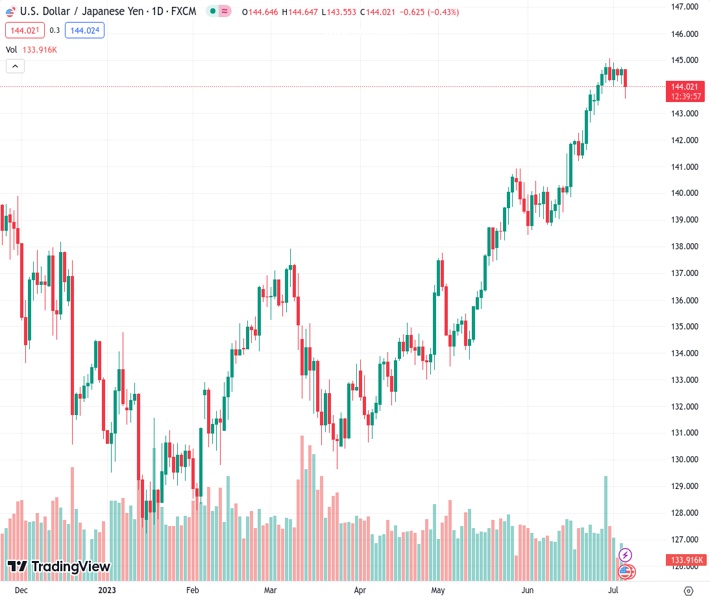
The USDJPY currency pair falls sharply to its lowest level in over a week on Thursday, but the decline does not continue with further selling.
…
This is a premium post.
[s2If !current_user_can(access_s2member_level4)]Please register for FREE REGISTER to read full post below containing analysis. In case of any error or you think you are not able to read the full post below, please email us at support#nehcap.com [lwa][/s2If] [s2If current_user_can(access_s2member_level1)]
- USD/JPY plummets to over a one-week low on Thursday, albeit lacks follow-through selling.
The pair currently trades last at 144.014.
The previous day high was 144.74 while the previous day low was 144.08. The daily 38.2% Fib levels comes at 144.49, expected to provide resistance. Similarly, the daily 61.8% fib level is at 144.33, expected to provide resistance.
The USD/JPY pair comes under intense selling pressure on Thursday and dives to a one-and-half-week low during the early part of the European session. Spot prices, however, manage to rebound a few pips in the last hour and currently trade around the 144.00 round-figure mark, still down nearly 0.50% for the day.
Fears of a possible intervention by Japanese authorities to prop up the domestic currency, along with the risk-off impulse, provide a goodish lift to the safe-haven Japanese Yen (JYP) and prompt aggressive selling around the USD/JPY pair. Apart from this, a modest US Dollar (USD) pullback from the weekly top further contributes to the offered tone.
That said, a big divergence in the monetary policy stance adopted by the Bank of Japan (BoJ) and other major central banks, including the Federal Reserve (Fed), caps any further gains for the JPY. Apart from this, a further rise in the US Treasury bond yields acts as a tailwind for the Greenback and limits losses for the USD/JPY pair, at least for now.
From a technical perspective, the sharp intraday slide finds support near the 143.60 region, or the 23.6% Fibonacci retracement level of the June rally, which should now act as a pivotal point. Some follow-through selling will validate a breakdown through a short-term trading range held over the past week or so and pave the way for further losses.
The USD/JPY pair might then accelerate the corrective decline towards testing the 100-period Simple Moving Average (SMA), currently pegged around the 143.00 round figure. This is closely followed by the 142.70-142.65 support or the 38.2% Fibo. level, which if broken decisively will suggest that spot prices have topped out near the 145.00 mark.
On the flip side, any recovery back above the trading range support breakpoint, around the 144.15-144.20 area, is likely to confront some resistance near the 144.70-144.75 supply zone. This is followed by the critical 145.00 psychological mark, above which the USD/JPY pair might aim to surpass the 145.35-145.40 barrier and reclaim the 146.00 round figure.
Technical Levels: Supports and Resistances
USDJPY currently trading at 143.91 at the time of writing. Pair opened at 144.66 and is trading with a change of -0.52 % .
| Overview | Overview.1 | |
|---|---|---|
| 0 | Today last price | 143.91 |
| 1 | Today Daily Change | -0.75 |
| 2 | Today Daily Change % | -0.52 |
| 3 | Today daily open | 144.66 |
The pair remains strongly bullish on the daily timeframe. It trades above its 20 SMA @ 142.37, 50 SMA 139.44, 100 SMA @ 136.62 and 200 SMA @ 137.24.
| Trends | Trends.1 | |
|---|---|---|
| 0 | Daily SMA20 | 142.37 |
| 1 | Daily SMA50 | 139.44 |
| 2 | Daily SMA100 | 136.62 |
| 3 | Daily SMA200 | 137.24 |
The previous day high was 144.74 while the previous day low was 144.08. The daily 38.2% Fib levels comes at 144.49, expected to provide resistance. Similarly, the daily 61.8% fib level is at 144.33, expected to provide resistance.
Note the levels of interest below:
- Pivot support is noted at 144.25, 143.84, 143.59
- Pivot resistance is noted at 144.9, 145.15, 145.56
| Levels | Levels.1 |
|---|---|
| Previous Daily High | 144.74 |
| Previous Daily Low | 144.08 |
| Previous Weekly High | 145.07 |
| Previous Weekly Low | 142.94 |
| Previous Monthly High | 145.07 |
| Previous Monthly Low | 138.43 |
| Daily Fibonacci 38.2% | 144.49 |
| Daily Fibonacci 61.8% | 144.33 |
| Daily Pivot Point S1 | 144.25 |
| Daily Pivot Point S2 | 143.84 |
| Daily Pivot Point S3 | 143.59 |
| Daily Pivot Point R1 | 144.90 |
| Daily Pivot Point R2 | 145.15 |
| Daily Pivot Point R3 | 145.56 |
[/s2If]
Nehcap Expert Advisor
The NEHCAP MT4 EA is high quality professional trading system geared to generate returns without using GRID or martingales. Each trade has strict risk per trade parameter. The pairs under management include EURUSD, GBPUSD, AUDCAD, AUDNZD,GBPAUD, EURAUD, EURCAD, CHFJPY and many more.
The system is trading live: LIVE ACCOUNT TRACKING
You can run it free. Apply for a free trial and track our account. Buy the system or use profit share mechanism to generate returns on your MT4.
Join Our Telegram Group
")


