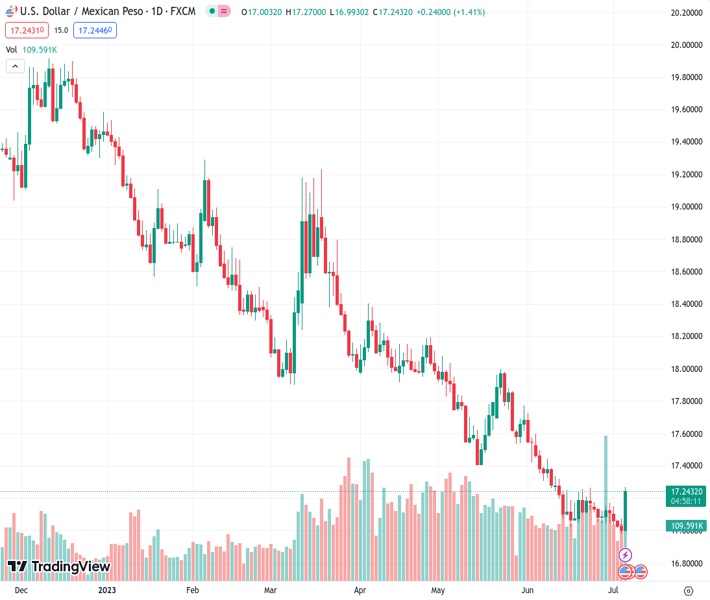
The US dollar to Mexican peso exchange rate, currently at 17.2599, has experienced a recovery from its lowest point this year and is now on an upward trend towards 17.20. This increase is primarily driven by encouraging economic information from the United States.
…
This is a premium post.
[s2If !current_user_can(access_s2member_level4)]Please register for FREE REGISTER to read full post below containing analysis. In case of any error or you think you are not able to read the full post below, please email us at support#nehcap.com [lwa][/s2If] [s2If current_user_can(access_s2member_level1)]
- USD/MXN rebounds off year-to-date lows, climbing towards 17.20, fueled by positive US economic data.
The pair currently trades last at 17.2599.
The previous day high was 17.076 while the previous day low was 16.9803. The daily 38.2% Fib levels comes at 17.0168, expected to provide support. Similarly, the daily 61.8% fib level is at 17.0394, expected to provide support.
USD/MXN rebounds off year-to-date (YTD) lows reached beneath the 17.00 figure, rises steadily past the 17.10 mark on solid data from the United States (US), showing the economy’s resilience despite 500 bps of tightening and expectations for more aggressive monetary policy. Hence, the USD/MXN moved upwards from a YTD low of 16.9761 to the 17.20 region at the time of writing.
A busy US economic calendar on Thursday began with the ADP National Employment report from June, which shows that private hiring skyrocketed to 497K, above estimates of 228K. The latest consumer sentiment poll showed that Americans were upbeat about the labor market in the last month, relative to May. Further data showed that Initial Jobless Claims exceeded 245K estimates and rose by 248K in the week ending July 1. Although it showed signs of easing, private hiring revealed by ADP could be a prelude to Friday’s US Nonfarm Payrolls, reported to be announced on July 7.
JOLTs data revealed that job vacancies dropped in May though they remained high, with figures rising by 9.824M, falling almost 500K, and missing the 9.935M estimated.
Aside from labor market data, the US ISM Non-Manufacturing PMI for June came above estimates of 51 and climbed to 53.9. Digging deep into the report, a measure of prices paid showed signs of deflation.
After the data, money market futures showed odds for a 25 bps hike by the Federal Reserve (Fed) increased to 95%, while for the November meeting increased to 38%. Consequently, US Treasury bond yields advanced above 4% for the first time since March 2023.
The USD/MXN resumed its uptrend on higher US Treasury bond yields. Also, comments from the Dallas Fed President Lorie Logan that she favored a rate hike in June were a catalyst for USD/MXN to lift the exchange rate from 17.12 toward the 17.20s area.
The USD/MXN remains downward biased but jumped above the 20-day Exponential Moving Average (EMA) at 17.1802. If USD/MXN achieves a daily close above the latter, the USD/MXN can rally toward the May 17 daily low of 17.4039, a crucial resistance level that, once cracked, can pave the way to challenge the 50-day EMA at 17.4460 before challenging 17.5000. Conversely, if USD/MXN drops beneat 17.1802, the pair could test the 17.00 mark.
Technical Levels: Supports and Resistances
USDMXN currently trading at 17.2174 at the time of writing. Pair opened at 17.005 and is trading with a change of 1.25 % .
| Overview | Overview.1 | |
|---|---|---|
| 0 | Today last price | 17.2174 |
| 1 | Today Daily Change | 0.2124 |
| 2 | Today Daily Change % | 1.2500 |
| 3 | Today daily open | 17.0050 |
The pair is trading above its 20 Daily moving average @ 17.146, below its 50 Daily moving average @ 17.4846 , below its 100 Daily moving average @ 17.8852 and below its 200 Daily moving average @ 18.6544
| Trends | Trends.1 | |
|---|---|---|
| 0 | Daily SMA20 | 17.1460 |
| 1 | Daily SMA50 | 17.4846 |
| 2 | Daily SMA100 | 17.8852 |
| 3 | Daily SMA200 | 18.6544 |
The previous day high was 17.076 while the previous day low was 16.9803. The daily 38.2% Fib levels comes at 17.0168, expected to provide support. Similarly, the daily 61.8% fib level is at 17.0394, expected to provide support.
Note the levels of interest below:
- Pivot support is noted at 16.9648, 16.9247, 16.8692
- Pivot resistance is noted at 17.0605, 17.1161, 17.1562
| Levels | Levels.1 |
|---|---|
| Previous Daily High | 17.0760 |
| Previous Daily Low | 16.9803 |
| Previous Weekly High | 17.1791 |
| Previous Weekly Low | 17.0456 |
| Previous Monthly High | 17.7286 |
| Previous Monthly Low | 17.0243 |
| Daily Fibonacci 38.2% | 17.0168 |
| Daily Fibonacci 61.8% | 17.0394 |
| Daily Pivot Point S1 | 16.9648 |
| Daily Pivot Point S2 | 16.9247 |
| Daily Pivot Point S3 | 16.8692 |
| Daily Pivot Point R1 | 17.0605 |
| Daily Pivot Point R2 | 17.1161 |
| Daily Pivot Point R3 | 17.1562 |
[/s2If]
Nehcap Expert Advisor
The NEHCAP MT4 EA is high quality professional trading system geared to generate returns without using GRID or martingales. Each trade has strict risk per trade parameter. The pairs under management include EURUSD, GBPUSD, AUDCAD, AUDNZD,GBPAUD, EURAUD, EURCAD, CHFJPY and many more.
The system is trading live: LIVE ACCOUNT TRACKING
You can run it free. Apply for a free trial and track our account. Buy the system or use profit share mechanism to generate returns on your MT4.
Join Our Telegram Group
")


