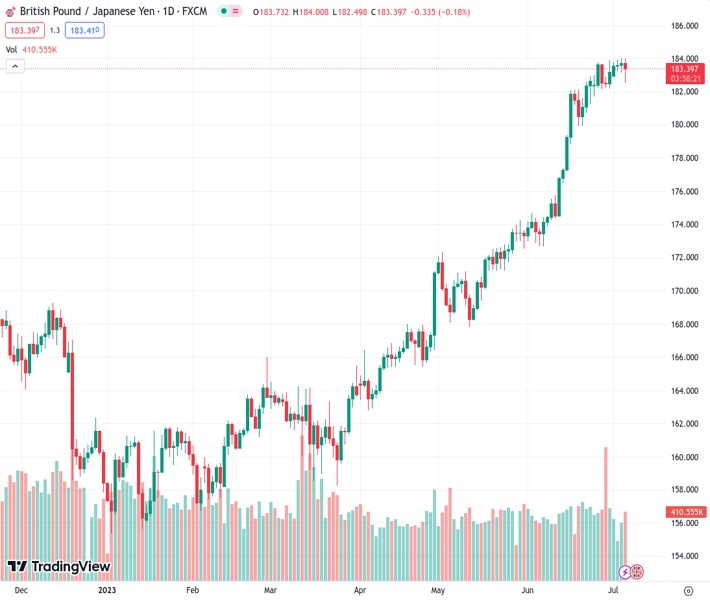
The GBPJPY currency pair dropped to around 182.50 from the previous level of 183.412 before finding stability above 183.00.
…
This is a premium post.
[s2If !current_user_can(access_s2member_level4)]Please register for FREE REGISTER to read full post below containing analysis. In case of any error or you think you are not able to read the full post below, please email us at support#nehcap.com [lwa][/s2If] [s2If current_user_can(access_s2member_level1)]
- GBP/JPY fell towards the 182.50 level and then stabilised above 183.00.
The pair currently trades last at 183.412.
The previous day high was 184.02 while the previous day low was 183.16. The daily 38.2% Fib levels comes at 183.69, expected to provide resistance. Similarly, the daily 61.8% fib level is at 183.48, expected to provide resistance.
On Thursday, the GBP/JPY trades with losses after three consecutive gains as the cross retreats from overbought conditions. After falling towards 182.50, the pair jumped back towards 183.30, but further downside shouldn’t be ruled out.
That being said, the rising British due to UK Debt Management Office selling bond yielding 5.668% will limit the GBP’s losses. The 2-year gilt stands rose to 5.55%, its highest level since 2007, while the 5 and 10-year yields stand at 4.95% and 4.70%, respectively, more than 3% increases.
Moreover, ADP’s hot employment figures from the US fueled an increase of US Treasury yields which also limited the JPY advance.
On Friday, at the early Asian session, investors will eye Labor Cash Earnings data from Japan from May, expected to decelerate to 0.7% YoY from the previous 1%. In addition, the focus will be Non-Farm Payrolls (NFP) from June from the US, which are expected to slip to 225K from the previous 339K. In that sense, the outcome of the NFP figures may fuel volatility in the US bond market and hence affect the JPY and GBP’s price dynamics.
According to the daily chart, the cross is still poised for further downside. Technical indicators, specifically the Relative Strength Index (RSI) and Moving Average Convergence Divergence (MACD), show weakness, indicating that the bears are starting to take the lead.
On the downside, support levels for the cross line up at the daily low of 182.50, followed by the 182.00 zone and the 181.50 area. On the flip side, resistances to monitor line up at 183.50 and the cycle high at 184.00.
Technical Levels: Supports and Resistances
GBPJPY currently trading at 183.47 at the time of writing. Pair opened at 183.78 and is trading with a change of -0.17 % .
| Overview | Overview.1 | |
|---|---|---|
| 0 | Today last price | 183.47 |
| 1 | Today Daily Change | -0.31 |
| 2 | Today Daily Change % | -0.17 |
| 3 | Today daily open | 183.78 |
The pair remains strongly bullish on the daily timeframe. It trades above its 20 SMA @ 180.7, 50 SMA 175.21, 100 SMA @ 169.4 and 200 SMA @ 166.5.
| Trends | Trends.1 | |
|---|---|---|
| 0 | Daily SMA20 | 180.70 |
| 1 | Daily SMA50 | 175.21 |
| 2 | Daily SMA100 | 169.40 |
| 3 | Daily SMA200 | 166.50 |
The previous day high was 184.02 while the previous day low was 183.16. The daily 38.2% Fib levels comes at 183.69, expected to provide resistance. Similarly, the daily 61.8% fib level is at 183.48, expected to provide resistance.
Note the levels of interest below:
- Pivot support is noted at 183.29, 182.79, 182.43
- Pivot resistance is noted at 184.15, 184.51, 185.01
| Levels | Levels.1 |
|---|---|
| Previous Daily High | 184.02 |
| Previous Daily Low | 183.16 |
| Previous Weekly High | 183.88 |
| Previous Weekly Low | 181.69 |
| Previous Monthly High | 183.88 |
| Previous Monthly Low | 172.67 |
| Daily Fibonacci 38.2% | 183.69 |
| Daily Fibonacci 61.8% | 183.48 |
| Daily Pivot Point S1 | 183.29 |
| Daily Pivot Point S2 | 182.79 |
| Daily Pivot Point S3 | 182.43 |
| Daily Pivot Point R1 | 184.15 |
| Daily Pivot Point R2 | 184.51 |
| Daily Pivot Point R3 | 185.01 |
[/s2If]
Nehcap Expert Advisor
The NEHCAP MT4 EA is high quality professional trading system geared to generate returns without using GRID or martingales. Each trade has strict risk per trade parameter. The pairs under management include EURUSD, GBPUSD, AUDCAD, AUDNZD,GBPAUD, EURAUD, EURCAD, CHFJPY and many more.
The system is trading live: LIVE ACCOUNT TRACKING
You can run it free. Apply for a free trial and track our account. Buy the system or use profit share mechanism to generate returns on your MT4.
Join Our Telegram Group
")


