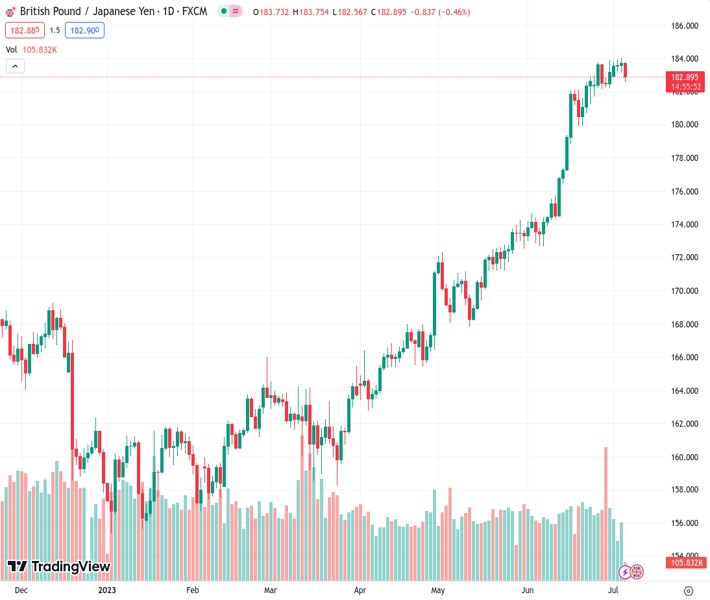
The GBPJPY currency pair, currently trading at 182.856, is facing a significant daily decline, which is the largest in a week. This is due to the confirmation of a bearish chart pattern and being pushed down towards the intraday low seen recently. According to the perspective of @nehcap, it is anticipated that the currency pair will continue to weaken.
…
This is a premium post.
[s2If !current_user_can(access_s2member_level4)]Please register for FREE REGISTER to read full post below containing analysis. In case of any error or you think you are not able to read the full post below, please email us at support#nehcap.com [lwa][/s2If] [s2If current_user_can(access_s2member_level1)]
- GBP/JPY eyes the biggest daily loss in a week after confirming bearish chart formation, pressured around intraday low of late.
The pair currently trades last at 182.856.
The previous day high was 184.02 while the previous day low was 183.16. The daily 38.2% Fib levels comes at 183.69, expected to provide resistance. Similarly, the daily 61.8% fib level is at 183.48, expected to provide resistance.
GBP/JPY takes offers to refresh the weekly low around 182.70 heading into Thursday’s London open. The cross-currency pair’s latest weakness could be linked to the market’s risk-off mood. However, the firmer yields should have prod the quote of late.
Also read: Asian stocks drop as S&P500 Futures slide to 4,470, US Treasury bond yields refresh three-month high
In doing so, the cross-currency pair justifies the previous day’s confirmation of the one-week-old rising wedge bearish chart pattern. Additionally favoring the pair sellers is the quote’s sustained break of the 200-Hour Moving Average (HMA), as well as the bearish MACD signals.
That said, the GBP/JPY becomes vulnerable to testing the rising wedge’s theoretical target of around 180.90. However, the late June swing high near 181.50 and the 180.00 round figure are extra filters toward the south that gain the market’s attention.
Meanwhile, the June 20 swing low of around 179.90 appears the last defense of the short-term GBP/JPY buyers.
On the flip side, 200-HMA and the bottom line of the aforementioned wedge limit short-term recovery of the GBP/JPY pair around 183.10 and 183.20 in that order.
Following that, an upward-sloping support line from June 21 and the stated wedge’s top line, respectively near 183.50 and 184.05, can challenge the GBP/JPY buyers before giving them control.
Trend: Further weakness expected
Technical Levels: Supports and Resistances
GBPJPY currently trading at 182.81 at the time of writing. Pair opened at 183.78 and is trading with a change of -0.53% % .
| Overview | Overview.1 | |
|---|---|---|
| 0 | Today last price | 182.81 |
| 1 | Today Daily Change | -0.97 |
| 2 | Today Daily Change % | -0.53% |
| 3 | Today daily open | 183.78 |
The pair remains strongly bullish on the daily timeframe. It trades above its 20 SMA @ 180.7, 50 SMA 175.21, 100 SMA @ 169.4 and 200 SMA @ 166.5.
| Trends | Trends.1 | |
|---|---|---|
| 0 | Daily SMA20 | 180.70 |
| 1 | Daily SMA50 | 175.21 |
| 2 | Daily SMA100 | 169.40 |
| 3 | Daily SMA200 | 166.50 |
The previous day high was 184.02 while the previous day low was 183.16. The daily 38.2% Fib levels comes at 183.69, expected to provide resistance. Similarly, the daily 61.8% fib level is at 183.48, expected to provide resistance.
Note the levels of interest below:
- Pivot support is noted at 183.29, 182.79, 182.43
- Pivot resistance is noted at 184.15, 184.51, 185.01
| Levels | Levels.1 |
|---|---|
| Previous Daily High | 184.02 |
| Previous Daily Low | 183.16 |
| Previous Weekly High | 183.88 |
| Previous Weekly Low | 181.69 |
| Previous Monthly High | 183.88 |
| Previous Monthly Low | 172.67 |
| Daily Fibonacci 38.2% | 183.69 |
| Daily Fibonacci 61.8% | 183.48 |
| Daily Pivot Point S1 | 183.29 |
| Daily Pivot Point S2 | 182.79 |
| Daily Pivot Point S3 | 182.43 |
| Daily Pivot Point R1 | 184.15 |
| Daily Pivot Point R2 | 184.51 |
| Daily Pivot Point R3 | 185.01 |
[/s2If]
Nehcap Expert Advisor
The NEHCAP MT4 EA is high quality professional trading system geared to generate returns without using GRID or martingales. Each trade has strict risk per trade parameter. The pairs under management include EURUSD, GBPUSD, AUDCAD, AUDNZD,GBPAUD, EURAUD, EURCAD, CHFJPY and many more.
The system is trading live: LIVE ACCOUNT TRACKING
You can run it free. Apply for a free trial and track our account. Buy the system or use profit share mechanism to generate returns on your MT4.
Join Our Telegram Group
")


