The AUDUSD currency pair bounces back from its weekly low reached on Thursday, but it does not gain momentum and continues without a strong continuation of the upward movement.
…
This is a premium post.
[s2If !current_user_can(access_s2member_level4)]Please register for FREE REGISTER to read full post below containing analysis. In case of any error or you think you are not able to read the full post below, please email us at support#nehcap.com [lwa][/s2If] [s2If current_user_can(access_s2member_level1)]
- AUD/USD rebounds from the weekly low touched on Thursday, albeit lacks follow-through.
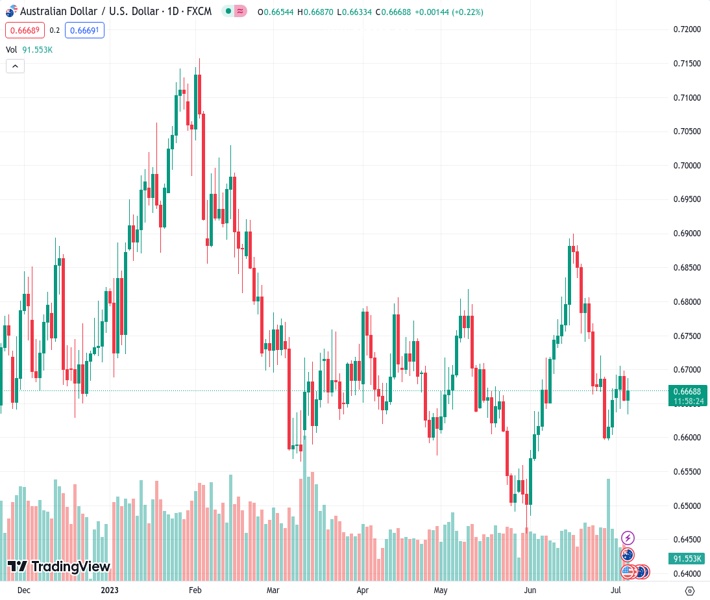
The pair currently trades last at 0.66696.
The previous day high was 0.6698 while the previous day low was 0.6653. The daily 38.2% Fib levels comes at 0.667, expected to provide resistance. Similarly, the daily 61.8% fib level is at 0.6681, expected to provide resistance.
The AUD/USD pair stages a goodish intraday recovery from a fresh weekly low touched this Thursday and rallies over 50 pips from the 0.6635-0.6630 area, though lacks follow-through. Spot prices quickly retreat a few pips from the daily top and currently trade around the 0.6665-0.6670 region, up just over 0.20% for the day.
The US Dollar (USD) pulls back from the vicinity of its highest level since June 12 touched last Friday and for now, seems to have stalled the uptrend witnessed since the beginning of the current week. This turns out to be a key factor that prompts some intraday short-covering around the AUD/USD pair. That said, the prospects for further policy tightening by the Federal Reserve (Fed), along with the risk-off impulse, help limit losses for the USD and cap the risk-sensitive Aussie.
The minutes from the June FOMC meeting released on Wednesday revealed that almost all members supported resuming rate hikes as inflation remains unacceptably high. This, in turn, reaffirms market bets for a 25 bps lift-off at the upcoming FOMC meeting on July 25-26 and leads to a further rise in the US Treasury bond yields. Adding to this, economic woes and the risk of a further escalation in the US-China trade conflict temper investors’ appetite for riskier assets.
It is worth recalling that China on Monday announced fresh export curbs on two metals – widely used in semiconductors, electric vehicles and high-tech industries – to the US. The announcement raises concerns about retaliatory measures and might cause more disruption to global trade. This could further undermine already weak economic conditions, which, in turn, takes its toll on the risk sentiment and forces investors to take refuge in safe-haven assets, including the USD.
The aforementioned fundamental backdrop makes it prudent to wait for strong follow-through buying before positioning for an extension of the AUD/USD pair’s recent bounce from sub-0.6600 levels. Market participants now look to the US economic docket – featuring the ADP report on private-sector employment, the usual Weekly Initial Jobless Clams, the ISM Services PMI and JOLTS Job Openings data – for a fresh impetus later during the early North American session.
Technical Levels: Supports and Resistances
AUDUSD currently trading at 0.6669 at the time of writing. Pair opened at 0.6655 and is trading with a change of 0.21 % .
| Overview | Overview.1 | |
|---|---|---|
| 0 | Today last price | 0.6669 |
| 1 | Today Daily Change | 0.0014 |
| 2 | Today Daily Change % | 0.2100 |
| 3 | Today daily open | 0.6655 |
The pair remains strongly bearish on the daily time frame. It trades below the 20 SMA @ 0.6733, 50 SMA 0.6676, 100 SMA @ 0.6692 and 200 SMA @ 0.6695.
| Trends | Trends.1 | |
|---|---|---|
| 0 | Daily SMA20 | 0.6733 |
| 1 | Daily SMA50 | 0.6676 |
| 2 | Daily SMA100 | 0.6692 |
| 3 | Daily SMA200 | 0.6695 |
The previous day high was 0.6698 while the previous day low was 0.6653. The daily 38.2% Fib levels comes at 0.667, expected to provide resistance. Similarly, the daily 61.8% fib level is at 0.6681, expected to provide resistance.
Note the levels of interest below:
- Pivot support is noted at 0.6639, 0.6623, 0.6594
- Pivot resistance is noted at 0.6684, 0.6714, 0.673
| Levels | Levels.1 |
|---|---|
| Previous Daily High | 0.6698 |
| Previous Daily Low | 0.6653 |
| Previous Weekly High | 0.6721 |
| Previous Weekly Low | 0.6595 |
| Previous Monthly High | 0.6900 |
| Previous Monthly Low | 0.6484 |
| Daily Fibonacci 38.2% | 0.6670 |
| Daily Fibonacci 61.8% | 0.6681 |
| Daily Pivot Point S1 | 0.6639 |
| Daily Pivot Point S2 | 0.6623 |
| Daily Pivot Point S3 | 0.6594 |
| Daily Pivot Point R1 | 0.6684 |
| Daily Pivot Point R2 | 0.6714 |
| Daily Pivot Point R3 | 0.6730 |
[/s2If]
Nehcap Expert Advisor
The NEHCAP MT4 EA is high quality professional trading system geared to generate returns without using GRID or martingales. Each trade has strict risk per trade parameter. The pairs under management include EURUSD, GBPUSD, AUDCAD, AUDNZD,GBPAUD, EURAUD, EURCAD, CHFJPY and many more.
The system is trading live: LIVE ACCOUNT TRACKING
You can run it free. Apply for a free trial and track our account. Buy the system or use profit share mechanism to generate returns on your MT4.
Join Our Telegram Group
")


