Gold’s value decreases by 0.20% as strong job numbers in the US and the likelihood of an increase in interest rates cause US Treasury yields to rise.
…
This is a premium post.
[s2If !current_user_can(access_s2member_level4)]Please register for FREE REGISTER to read full post below containing analysis. In case of any error or you think you are not able to read the full post below, please email us at support#nehcap.com [lwa][/s2If] [s2If current_user_can(access_s2member_level1)]
- Gold suffers a 0.20% loss as robust US job figures and mounting rate hike prospects drive US Treasury yields higher.
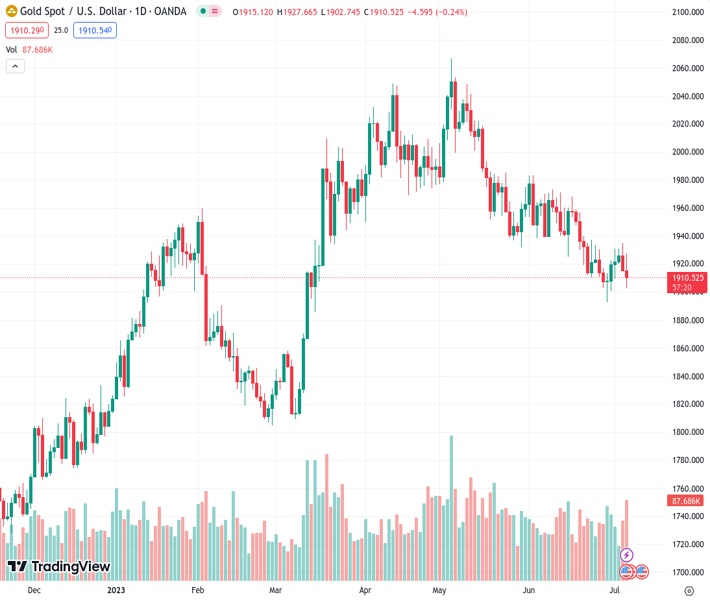
The pair currently trades last at 1910.25.
The previous day high was 1935.09 while the previous day low was 1914.84. The daily 38.2% Fib levels comes at 1922.58, expected to provide resistance. Similarly, the daily 61.8% fib level is at 1927.35, expected to provide resistance.
Gold price slides for two consecutive days after a busy economic calendar in the United States (US) emphasized the resilience of the economy, which justifies the Federal Reserve (Fed) 25 bps rate hike at the upcoming July meeting. On Thursday, the XAU/USD, after reaching a daily high of $1927.55, prints losses of 0.20% and exchanges hands at $1910.70.
The yellow metal is under pressure as the latest US ADP National Employment report surprised market participants, as private hiring witnessed the creation of 497,000 jobs in the US economy, surpassing the 228,000 foreseen by analysts. The report came before the US Department of Labor announced that unemployment claims (Initial Jobless Claims) for the week ending July 1 climbed to 248K, exceeding 245K estimates, but the ADP report overshadowed the data.
After the data, XAU/USD’s dropped from around $1928 to $1902, as US Treasury bond yields skyrocketed. The US 10-year Treasury note rises 4.045%, gaining 10 basis points. The US real yields soared to a new yearly high of 1.821%, though, as of writing, it sits at 1.781%, a headwind for the non-yielding metal.
Gold traders will get more clues about the yellow metal’s direction on Friday, as the US Bureau of Labor Statistics (BLS) will reveal the US Nonfarm Payrolls report. Analysts estimate the US economy addd 225K jobs to the economy, and the Unemployment rate is estimated to dip to 3.6%,
The Federal Reserve (Fed) meeting minutes showed that most officials wanted to raise rates but agreed to wait as they assessed the impact of cumulative tightening. Additionally, “almost all” FOMC members agreed that further tightening will be needed this year, suggesting July’s rate hike is almost inevitable.
Regarding that theme, the Dallas Fed President Lorie Logan at a Columbia University event in New York, stated she favored June’s hike, adding “two-thirds of FOMC participants projected at least two more rate increases this year.”
The XAU/USD daily chart depicts Gold as neutral to downward biased, with the 20, 50, and 100-day Exponential Moving Average (EMAs) remaining above the current spot price. For a bearish resumption, XAU/USD must drop below the 200-day EMA at $1896.93, and once done, the XAU/USD next support would be the March 6 daily high at $1879.45, followed by the March 8 swing low at $1809.48.
If XAU/USD remains above $1900, the first resistance would be the 20-day EMA at $1928.88. Once cleared, the next supply zone would be the 50-day EMA at $1945.75.
Technical Levels: Supports and Resistances
XAUUSD currently trading at 1911.07 at the time of writing. Pair opened at 1915.41 and is trading with a change of -0.23 % .
| Overview | Overview.1 | |
|---|---|---|
| 0 | Today last price | 1911.07 |
| 1 | Today Daily Change | -4.34 |
| 2 | Today Daily Change % | -0.23 |
| 3 | Today daily open | 1915.41 |
The pair is trading below its 20 Daily moving average @ 1933.75, below its 50 Daily moving average @ 1964.83 , below its 100 Daily moving average @ 1946.38 and above its 200 Daily moving average @ 1863.76
| Trends | Trends.1 | |
|---|---|---|
| 0 | Daily SMA20 | 1933.75 |
| 1 | Daily SMA50 | 1964.83 |
| 2 | Daily SMA100 | 1946.38 |
| 3 | Daily SMA200 | 1863.76 |
The previous day high was 1935.09 while the previous day low was 1914.84. The daily 38.2% Fib levels comes at 1922.58, expected to provide resistance. Similarly, the daily 61.8% fib level is at 1927.35, expected to provide resistance.
Note the levels of interest below:
- Pivot support is noted at 1908.47, 1901.53, 1888.22
- Pivot resistance is noted at 1928.72, 1942.03, 1948.97
| Levels | Levels.1 |
|---|---|
| Previous Daily High | 1935.09 |
| Previous Daily Low | 1914.84 |
| Previous Weekly High | 1933.39 |
| Previous Weekly Low | 1893.01 |
| Previous Monthly High | 1983.50 |
| Previous Monthly Low | 1893.01 |
| Daily Fibonacci 38.2% | 1922.58 |
| Daily Fibonacci 61.8% | 1927.35 |
| Daily Pivot Point S1 | 1908.47 |
| Daily Pivot Point S2 | 1901.53 |
| Daily Pivot Point S3 | 1888.22 |
| Daily Pivot Point R1 | 1928.72 |
| Daily Pivot Point R2 | 1942.03 |
| Daily Pivot Point R3 | 1948.97 |
[/s2If]
Nehcap Expert Advisor
The NEHCAP MT4 EA is high quality professional trading system geared to generate returns without using GRID or martingales. Each trade has strict risk per trade parameter. The pairs under management include EURUSD, GBPUSD, AUDCAD, AUDNZD,GBPAUD, EURAUD, EURCAD, CHFJPY and many more.
The system is trading live: LIVE ACCOUNT TRACKING
You can run it free. Apply for a free trial and track our account. Buy the system or use profit share mechanism to generate returns on your MT4.
Join Our Telegram Group
")


