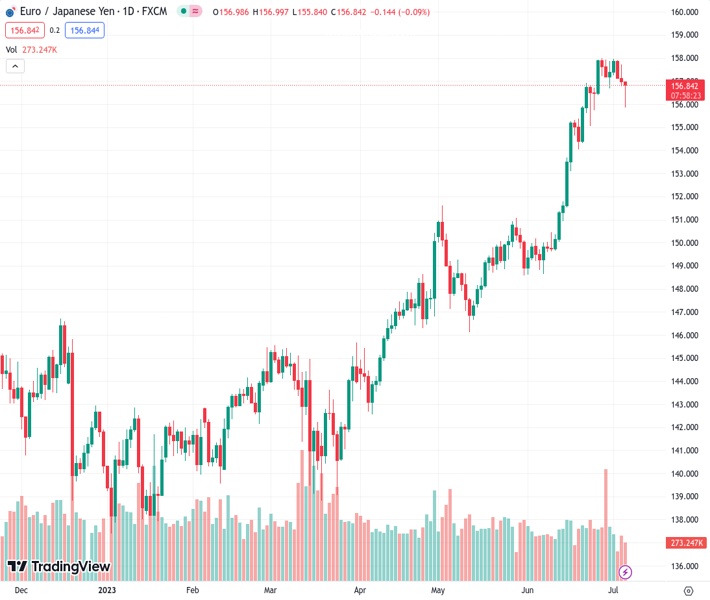
#EURJPY @ 156.806 adds to the weekly knee-jerk and breaches 156.00.
…
This is a premium post.
[s2If !current_user_can(access_s2member_level4)]Please register for FREE REGISTER to read full post below containing analysis. In case of any error or you think you are not able to read the full post below, please email us at support#nehcap.com [lwa][/s2If] [s2If current_user_can(access_s2member_level1)]
- EUR/JPY adds to the weekly knee-jerk and breaches 156.00.
The pair currently trades last at 156.806.
The previous day high was 157.72 while the previous day low was 156.79. The daily 38.2% Fib levels comes at 157.14, expected to provide resistance. Similarly, the daily 61.8% fib level is at 157.37, expected to provide resistance.
EUR/JPY extends the weekly bearish note to the sub-156.00 region on Thursday, where some initial support seems to have turned up.
The cross continues to retreat from overbought levels and further decline should not be ruled out for the time being. Against that, the door now appears open for the cross to challenge the weekly low at 154.04 (June 20).
So far, further upside looks favoured while the cross trades above the 200-day SMA, today at 145.50.
Technical Levels: Supports and Resistances
EURJPY currently trading at 156.84 at the time of writing. Pair opened at 157.01 and is trading with a change of -0.11 % .
| Overview | Overview.1 | |
|---|---|---|
| 0 | Today last price | 156.84 |
| 1 | Today Daily Change | 115.00 |
| 2 | Today Daily Change % | -0.11 |
| 3 | Today daily open | 157.01 |
The pair remains strongly bullish on the daily timeframe. It trades above its 20 SMA @ 154.97, 50 SMA 151.47, 100 SMA @ 147.87 and 200 SMA @ 145.46.
| Trends | Trends.1 | |
|---|---|---|
| 0 | Daily SMA20 | 154.97 |
| 1 | Daily SMA50 | 151.47 |
| 2 | Daily SMA100 | 147.87 |
| 3 | Daily SMA200 | 145.46 |
The previous day high was 157.72 while the previous day low was 156.79. The daily 38.2% Fib levels comes at 157.14, expected to provide resistance. Similarly, the daily 61.8% fib level is at 157.37, expected to provide resistance.
Note the levels of interest below:
- Pivot support is noted at 156.63, 156.24, 155.69
- Pivot resistance is noted at 157.56, 158.11, 158.5
| Levels | Levels.1 |
|---|---|
| Previous Daily High | 157.72 |
| Previous Daily Low | 156.79 |
| Previous Weekly High | 158.00 |
| Previous Weekly Low | 155.75 |
| Previous Monthly High | 158.00 |
| Previous Monthly Low | 148.62 |
| Daily Fibonacci 38.2% | 157.14 |
| Daily Fibonacci 61.8% | 157.37 |
| Daily Pivot Point S1 | 156.63 |
| Daily Pivot Point S2 | 156.24 |
| Daily Pivot Point S3 | 155.69 |
| Daily Pivot Point R1 | 157.56 |
| Daily Pivot Point R2 | 158.11 |
| Daily Pivot Point R3 | 158.50 |
[/s2If]
Nehcap Expert Advisor
The NEHCAP MT4 EA is high quality professional trading system geared to generate returns without using GRID or martingales. Each trade has strict risk per trade parameter. The pairs under management include EURUSD, GBPUSD, AUDCAD, AUDNZD,GBPAUD, EURAUD, EURCAD, CHFJPY and many more.
The system is trading live: LIVE ACCOUNT TRACKING
You can run it free. Apply for a free trial and track our account. Buy the system or use profit share mechanism to generate returns on your MT4.
Join Our Telegram Group
")


