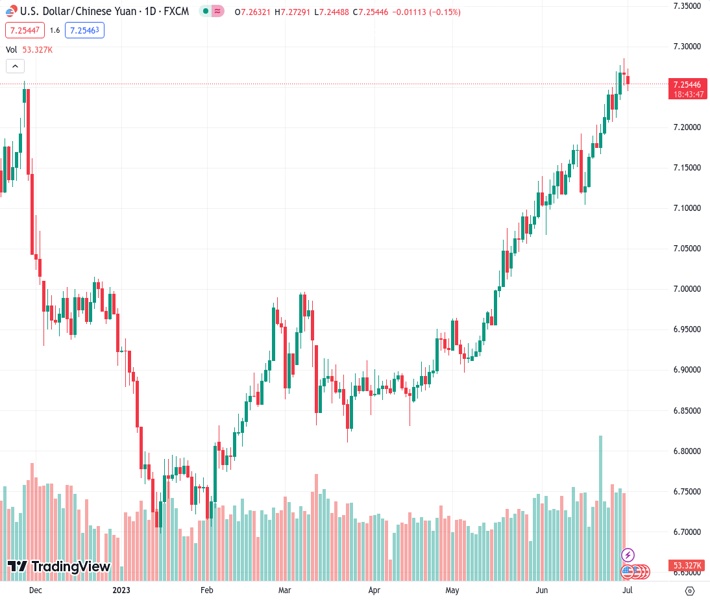
The USDCNH currency pair is facing ongoing downward pressure near its lowest point of the day, as it continues to retreat from its highest level seen since November 2022.
…
This is a premium post.
[s2If !current_user_can(access_s2member_level4)]Please register for FREE REGISTER to read full post below containing analysis. In case of any error or you think you are not able to read the full post below, please email us at support#nehcap.com [lwa][/s2If] [s2If current_user_can(access_s2member_level1)]
- USD/CNH remains pressured around intraday low, stretches pullback from the highest level since November 2022.
The pair currently trades last at 7.25462.
The previous day high was 7.2856 while the previous day low was 7.2514. The daily 38.2% Fib levels comes at 7.2645, expected to provide resistance. Similarly, the daily 61.8% fib level is at 7.2726, expected to provide resistance.
USD/CNH prints the biggest daily loss in a week, so far, with its quick slide to 7.2450 after better-than-expected China activity data. However, the mixed concerns about the US-China ties and the People’s Bank of China’s (PBoC) latest moves prod the offshore Chinese Yuan (CNH) pair early Monday.
That said, China’s Caixin Manufacturing PMI eased to 50.5 for June, from 50.9 prior, but came in above forecasts of 50.2.
On the other hand, the PBoC set the onshore Chinese Yuan (USD/CNY) rate at 7.2157 on Monday, versus the previous fix of 7.2258 and market expectations of 7.2464. It’s worth noting that the USD/CNY closed near 7.2510 the previous day. With this, the Chinese central bank’s onshore Yuan (CNY) fix retreats from the yearly top marked the previous day.
Elsewhere, mixed reactions to recently confirmed US Treasury Secretary Janet Yellen’s China visit during July 06-09 period test the USD/CNH traders. While the news appears positive for the sentiment on the front, the details seem less impressive as US Treasury Secretary Yellen is likely to flag concerns about human rights abuses against the Uyghur Muslim minority, China’s recent move to ban sales of Micron Technology memory chips, and moves by China against foreign due diligence and consulting firms, per Reuters.
It’s worth noting that the USD/CNH reversed from the multi-month high the previous day after the Federal Reserve’s (Fed) preferred inflation gauge, namely US Personal Consumption Expenditure (PCE) Price Index, for May, came in at 0.3% MoM and 4.6% YoY versus market expectations of reprinting the 0.4% and 4.7% figures for monthly and yearly prior readings. With this, the key inflation numbers marked the smallest yearly gain in six months.
On the same line, the Personal Consumption Expenditure (PCE) Price for Q1 2023 eased to 4.1% QoQ from 4.2% expected and prior whereas the Pending Home Sales slumped to -2.7% MoM for May compared to 0.2% expected and -0.4% prior (revised).
The cooling of spending and easy inflation challenge Fed Chair Jerome Powell’s support for “two more rate hikes in 2023” and prod the USD/CNH buyers.
Amid these plays, S&P500 Futures fail to trace the upbeat Wall Street performance whereas the US Treasury bond yields struggle of late.
Moving forward, the US ISM Manufacturing PMI for June will join the risk catalysts to direct intraday moves but major attention will be given to Fed Minutes and US jobs report for a clear guide.
Although Friday’s Doji candlestick on the daily chart, at a multi-month high, joins the overbought RSI (14) line to tease the USD/CNH bears, a fortnight-old support line, near 7.2530 at the latest, challenges the sellers.
Technical Levels: Supports and Resistances
USDCNH currently trading at 7.2514 at the time of writing. Pair opened at 7.2676 and is trading with a change of -0.22% % .
| Overview | Overview.1 | |
|---|---|---|
| 0 | Today last price | 7.2514 |
| 1 | Today Daily Change | -0.0162 |
| 2 | Today Daily Change % | -0.22% |
| 3 | Today daily open | 7.2676 |
The pair remains strongly bullish on the daily timeframe. It trades above its 20 SMA @ 7.1799, 50 SMA 7.0702, 100 SMA @ 6.9813 and 200 SMA @ 7.0015.
| Trends | Trends.1 | |
|---|---|---|
| 0 | Daily SMA20 | 7.1799 |
| 1 | Daily SMA50 | 7.0702 |
| 2 | Daily SMA100 | 6.9813 |
| 3 | Daily SMA200 | 7.0015 |
The previous day high was 7.2856 while the previous day low was 7.2514. The daily 38.2% Fib levels comes at 7.2645, expected to provide resistance. Similarly, the daily 61.8% fib level is at 7.2726, expected to provide resistance.
Note the levels of interest below:
- Pivot support is noted at 7.2508, 7.234, 7.2166
- Pivot resistance is noted at 7.285, 7.3024, 7.3192
| Levels | Levels.1 |
|---|---|
| Previous Daily High | 7.2856 |
| Previous Daily Low | 7.2514 |
| Previous Weekly High | 7.2856 |
| Previous Weekly Low | 7.2060 |
| Previous Monthly High | 7.2856 |
| Previous Monthly Low | 7.0668 |
| Daily Fibonacci 38.2% | 7.2645 |
| Daily Fibonacci 61.8% | 7.2726 |
| Daily Pivot Point S1 | 7.2508 |
| Daily Pivot Point S2 | 7.2340 |
| Daily Pivot Point S3 | 7.2166 |
| Daily Pivot Point R1 | 7.2850 |
| Daily Pivot Point R2 | 7.3024 |
| Daily Pivot Point R3 | 7.3192 |
[/s2If]
Nehcap Expert Advisor
The NEHCAP MT4 EA is high quality professional trading system geared to generate returns without using GRID or martingales. Each trade has strict risk per trade parameter. The pairs under management include EURUSD, GBPUSD, AUDCAD, AUDNZD,GBPAUD, EURAUD, EURCAD, CHFJPY and many more.
The system is trading live: LIVE ACCOUNT TRACKING
You can run it free. Apply for a free trial and track our account. Buy the system or use profit share mechanism to generate returns on your MT4.
Join Our Telegram Group
")


