The USDJPY currency pair is currently fluctuating and maintaining its previous significant increase to reach the highest point recorded since November 2022.
…
This is a premium post.
[s2If !current_user_can(access_s2member_level4)]Please register for FREE REGISTER to read full post below containing analysis. In case of any error or you think you are not able to read the full post below, please email us at support#nehcap.com [lwa][/s2If] [s2If current_user_can(access_s2member_level1)]
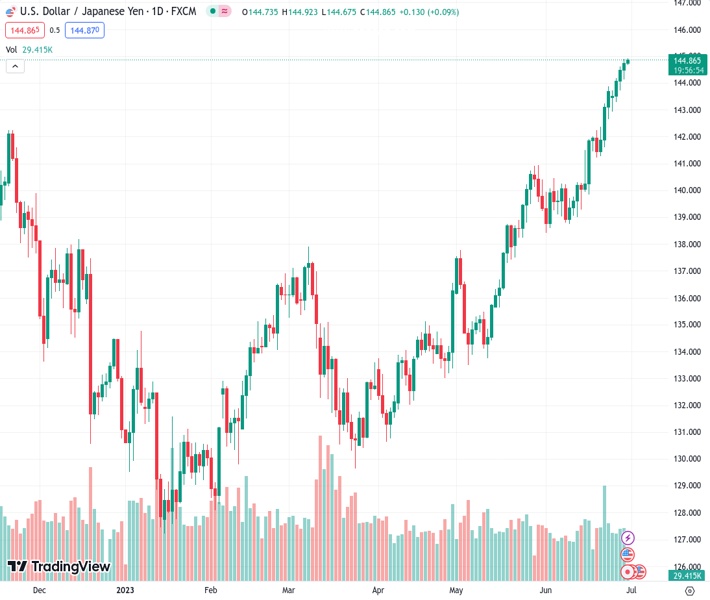
- USD/JPY consolidates its recent strong rise to the highest level since November 2022.
The pair currently trades last at 144.858.
The previous day high was 144.9 while the previous day low was 144.14. The daily 38.2% Fib levels comes at 144.61, expected to provide support. Similarly, the daily 61.8% fib level is at 144.43, expected to provide support.
The USD/JPY pair trades with a mild positive bias during the Asian session on Friday and is currently placed around the 144.80-144.85 region, or its highest level since November 2022.
Despite the recent verbal intervention by Japanese authorities, expectations that the Bank of Japan’s (BoJ) negative interest-rate policy will remain in place at least until next year continues to undermine the Japanese Yen. In fact, BoJ Governor Kazuo Ueda recently ruled out the possibility of any change in ultra-loose policy settings and signalled no immediate plans to alter the yield curve control measures. This, along with the recent rise in the US Dollar (USD), turns out to be a key factor acting as a tailwind for the USD/JPY pair.
The JPY bulls, meanwhile, seem rather unimpressed by that fact that core consumer prices in Japan’s capital stays above the central bank’s 2% target for the 13th straight month. In fact, Japan’s Statistics Bureau reported that Tokyo Core Consumer Price Index (CPI), which excludes volatile fresh food prices, grew by the 3.2% YoY pace in June. Furthermore, a core inflation gauge, which ignores both fresh food and energy prices, rose 3.8% through June and remained close to a 40-year peak touched in the previous month.
The USD, on the other hand, stands tall near a two-week high touched the previous day and remains well supported by the Federal Reserve’s (Fed) hawkish outlook. It is worth recalling that the Fed earlier this month siganlled that borrowing costs may still need to rise as much as 50 bps by the end of this year. Adding to this, the upbeat US macro data released on Thursday gives the Fed another reason to continue raising interest rates. This further lends support to the USD/JPY pair and supports prospects for additional gains.
That said, technical indicators on the daily chart are flashing overbought conditions and might hold back traders from placing fresh bullish bets. Market participants might also prefer to wait on the sidelines ahead of the release of the US Core PCE Price Index – the Fed’s preferred inflation gauge – later during the early North American session. The crucial data will influence expectations about the Fed’s furture rate hike path, which, in turn, will drive the USD demand and provide a fresh directional impetus to the USD/JPY pair.
Technical Levels: Supports and Resistances
USDJPY currently trading at 144.78 at the time of writing. Pair opened at 144.75 and is trading with a change of 0.02 % .
| Overview | Overview.1 | |
|---|---|---|
| 0 | Today last price | 144.78 |
| 1 | Today Daily Change | 0.03 |
| 2 | Today Daily Change % | 0.02 |
| 3 | Today daily open | 144.75 |
The pair remains strongly bullish on the daily timeframe. It trades above its 20 SMA @ 141.43, 50 SMA 138.6, 100 SMA @ 136.14 and 200 SMA @ 137.23.
| Trends | Trends.1 | |
|---|---|---|
| 0 | Daily SMA20 | 141.43 |
| 1 | Daily SMA50 | 138.60 |
| 2 | Daily SMA100 | 136.14 |
| 3 | Daily SMA200 | 137.23 |
The previous day high was 144.9 while the previous day low was 144.14. The daily 38.2% Fib levels comes at 144.61, expected to provide support. Similarly, the daily 61.8% fib level is at 144.43, expected to provide support.
Note the levels of interest below:
- Pivot support is noted at 144.29, 143.83, 143.52
- Pivot resistance is noted at 145.06, 145.36, 145.82
| Levels | Levels.1 |
|---|---|
| Previous Daily High | 144.90 |
| Previous Daily Low | 144.14 |
| Previous Weekly High | 143.87 |
| Previous Weekly Low | 141.21 |
| Previous Monthly High | 140.93 |
| Previous Monthly Low | 133.50 |
| Daily Fibonacci 38.2% | 144.61 |
| Daily Fibonacci 61.8% | 144.43 |
| Daily Pivot Point S1 | 144.29 |
| Daily Pivot Point S2 | 143.83 |
| Daily Pivot Point S3 | 143.52 |
| Daily Pivot Point R1 | 145.06 |
| Daily Pivot Point R2 | 145.36 |
| Daily Pivot Point R3 | 145.82 |
[/s2If]
Nehcap Expert Advisor
The NEHCAP MT4 EA is high quality professional trading system geared to generate returns without using GRID or martingales. Each trade has strict risk per trade parameter. The pairs under management include EURUSD, GBPUSD, AUDCAD, AUDNZD,GBPAUD, EURAUD, EURCAD, CHFJPY and many more.
The system is trading live: LIVE ACCOUNT TRACKING
You can run it free. Apply for a free trial and track our account. Buy the system or use profit share mechanism to generate returns on your MT4.
Join Our Telegram Group
")


