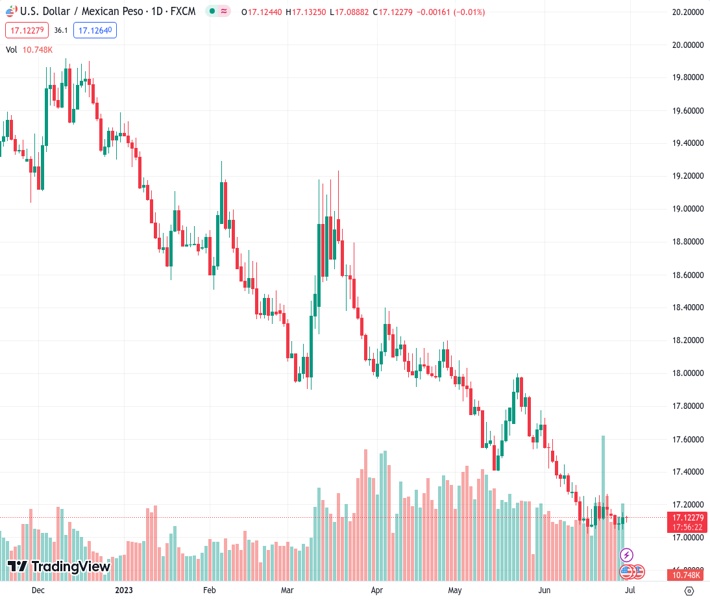
The US dollar to Mexican peso exchange rate, currently at 17.1224, continues to experience small price fluctuations and remains within a well-known range.
…
This is a premium post.
[s2If !current_user_can(access_s2member_level4)]Please register for FREE REGISTER to read full post below containing analysis. In case of any error or you think you are not able to read the full post below, please email us at support#nehcap.com [lwa][/s2If] [s2If current_user_can(access_s2member_level1)]
- USD/MXN extends its consolidative price moves and remains confined in a familiar range.
The pair currently trades last at 17.1224.
The previous day high was 17.153 while the previous day low was 17.0694. The daily 38.2% Fib levels comes at 17.1211, expected to provide support. Similarly, the daily 61.8% fib level is at 17.1013, expected to provide support.
The USD/MXN pair struggles to capitalize on the previous day’s positive move and oscillates in a narrow trading band, just above the 17.00 mark through the Asian session on Friday.
The range-bound price action witnessed over the past two weeks or so constitutes the formation of a rectangle on the daily chart. Against the backdrop of the recent downfall from the 18.00 mark touched on May 23, this might still be categorized as a bearish consolidation phase and supports prospects for additional losses. The negative outlook is reinforced by the fact that oscillators on the daily chart have recovered from the oversold zone and are holding deep in the bearish territory.
The aforementioned technical setup suggests that the path of least resistance for the USD/MXN pair is to the downside. That said, it will still be prudent to wait for a sustained break and acceptance below the 17.00 round figure before positioning for the resumption of over a three-month-old descending trend. Spot prices might then turn vulnerable to accelerate the slide towards the 16.60-16.55 intermediate support before dropping to November 2015 low, around the 16.35 area.
On the flip side, last week’s swing high, around the 17.20-17.25 region, also representing the trading range barrier, should cap the immediate upside for the USD/MXN pair. A sustained strength beyond might trigger a short-covering rally towards the 17.40-17.45 region. This is closely followed by the 50-day Simple Moving Average (SMA), currently pegged near the 17.55 zone, which if cleared will suggest that spot prices have bottomed out and pave the way for further gains.
Technical Levels: Supports and Resistances
USDMXN currently trading at 17.1164 at the time of writing. Pair opened at 17.1252 and is trading with a change of -0.05 % .
| Overview | Overview.1 | |
|---|---|---|
| 0 | Today last price | 17.1164 |
| 1 | Today Daily Change | -0.0088 |
| 2 | Today Daily Change % | -0.0500 |
| 3 | Today daily open | 17.1252 |
The pair remains strongly bearish on the daily time frame. It trades below the 20 SMA @ 17.223, 50 SMA 17.5638, 100 SMA @ 17.9462 and 200 SMA @ 18.7188.
| Trends | Trends.1 | |
|---|---|---|
| 0 | Daily SMA20 | 17.2230 |
| 1 | Daily SMA50 | 17.5638 |
| 2 | Daily SMA100 | 17.9462 |
| 3 | Daily SMA200 | 18.7188 |
The previous day high was 17.153 while the previous day low was 17.0694. The daily 38.2% Fib levels comes at 17.1211, expected to provide support. Similarly, the daily 61.8% fib level is at 17.1013, expected to provide support.
Note the levels of interest below:
- Pivot support is noted at 17.0788, 17.0323, 16.9952
- Pivot resistance is noted at 17.1624, 17.1995, 17.246
| Levels | Levels.1 |
|---|---|
| Previous Daily High | 17.1530 |
| Previous Daily Low | 17.0694 |
| Previous Weekly High | 17.2656 |
| Previous Weekly Low | 17.0610 |
| Previous Monthly High | 18.0780 |
| Previous Monthly Low | 17.4203 |
| Daily Fibonacci 38.2% | 17.1211 |
| Daily Fibonacci 61.8% | 17.1013 |
| Daily Pivot Point S1 | 17.0788 |
| Daily Pivot Point S2 | 17.0323 |
| Daily Pivot Point S3 | 16.9952 |
| Daily Pivot Point R1 | 17.1624 |
| Daily Pivot Point R2 | 17.1995 |
| Daily Pivot Point R3 | 17.2460 |
[/s2If]
Nehcap Expert Advisor
The NEHCAP MT4 EA is high quality professional trading system geared to generate returns without using GRID or martingales. Each trade has strict risk per trade parameter. The pairs under management include EURUSD, GBPUSD, AUDCAD, AUDNZD,GBPAUD, EURAUD, EURCAD, CHFJPY and many more.
The system is trading live: LIVE ACCOUNT TRACKING
You can run it free. Apply for a free trial and track our account. Buy the system or use profit share mechanism to generate returns on your MT4.
Join Our Telegram Group
")


