The NZDUSD currency pair is currently holding onto slight declines at its lowest levels in three weeks. The viewpoint of Nehcap is that they do not anticipate significant further decreases.
…
This is a premium post.
[s2If !current_user_can(access_s2member_level4)]Please register for FREE REGISTER to read full post below containing analysis. In case of any error or you think you are not able to read the full post below, please email us at support#nehcap.com [lwa][/s2If] [s2If current_user_can(access_s2member_level1)]
- NZD/USD clings to mild losses at the lowest levels in three weeks.
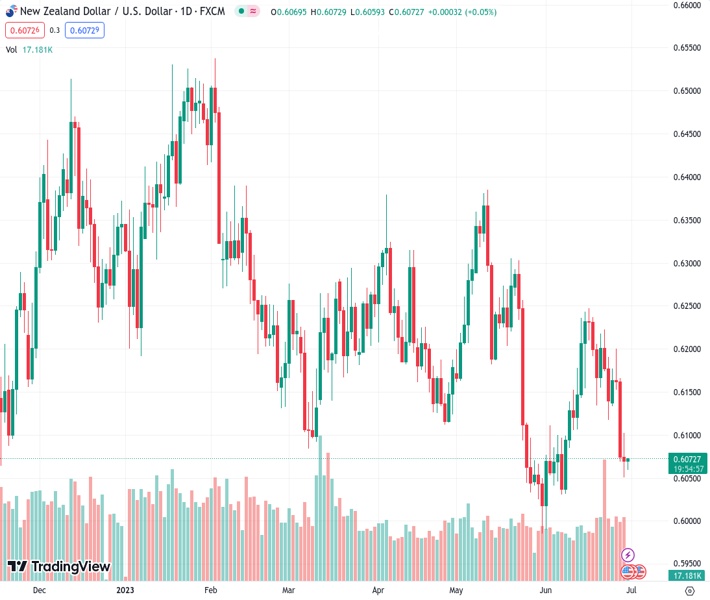
The pair currently trades last at 0.60696.
The previous day high was 0.6112 while the previous day low was 0.605. The daily 38.2% Fib levels comes at 0.6074, expected to provide resistance. Similarly, the daily 61.8% fib level is at 0.6088, expected to provide resistance.
NZD/USD traders lick their wounds at the lowest levels in three weeks while making rounds to the 0.6050-60 area amid Friday’s mid-Asian session. In doing so, the Kiwi pair drops for the third consecutive day but lacks downside momentum of late.
That said, the oversold RSI (14) line prods the NZD/USD bears of late. Also challenging the sellers is the receding bearish bias of the MACD signals.
It should be noted, however, that the Kiwi pair’s sustained downside break of the monthly support line, 100-SMA and a two-week-old bearish channel keeps the sellers hopeful.
Hence, a horizontal area comprising multiple levels marked since late May, around 0.6030, can allow the NZD/USD prices to consolidate before marking the fresh leg towards the south.
In that case, the 0.6000 round figure and the yearly low marked in May around 0.5985 will be in the spotlight.
On the contrary, the bottom line of the fortnight-old bearish channel, around the 0.6100 threshold, restricts the immediate recovery of the NZD/USD pair.
Following that, a convergence of the 100-SMA and the previous support line from May 31, close to 0.6155-60, could challenge the Kiwi pair buyers.
Even if the NZD/USD bulls dominate past 0.6160, the top line of the stated channel and the late May swing high, respectively near 0.6185 and 0.6310 will act as extra checks for the buyers.
Trend: Limited downside expected
Technical Levels: Supports and Resistances
NZDUSD currently trading at 0.606 at the time of writing. Pair opened at 0.607 and is trading with a change of -0.16 % .
| Overview | Overview.1 | |
|---|---|---|
| 0 | Today last price | 0.606 |
| 1 | Today Daily Change | -0.001 |
| 2 | Today Daily Change % | -0.160 |
| 3 | Today daily open | 0.607 |
The pair remains strongly bearish on the daily time frame. It trades below the 20 SMA @ 0.6138, 50 SMA 0.6167, 100 SMA @ 0.6197 and 200 SMA @ 0.616.
| Trends | Trends.1 | |
|---|---|---|
| 0 | Daily SMA20 | 0.6138 |
| 1 | Daily SMA50 | 0.6167 |
| 2 | Daily SMA100 | 0.6197 |
| 3 | Daily SMA200 | 0.6160 |
The previous day high was 0.6112 while the previous day low was 0.605. The daily 38.2% Fib levels comes at 0.6074, expected to provide resistance. Similarly, the daily 61.8% fib level is at 0.6088, expected to provide resistance.
Note the levels of interest below:
- Pivot support is noted at 0.6043, 0.6015, 0.5981
- Pivot resistance is noted at 0.6105, 0.6139, 0.6167
| Levels | Levels.1 |
|---|---|
| Previous Daily High | 0.6112 |
| Previous Daily Low | 0.6050 |
| Previous Weekly High | 0.6237 |
| Previous Weekly Low | 0.6116 |
| Previous Monthly High | 0.6385 |
| Previous Monthly Low | 0.5985 |
| Daily Fibonacci 38.2% | 0.6074 |
| Daily Fibonacci 61.8% | 0.6088 |
| Daily Pivot Point S1 | 0.6043 |
| Daily Pivot Point S2 | 0.6015 |
| Daily Pivot Point S3 | 0.5981 |
| Daily Pivot Point R1 | 0.6105 |
| Daily Pivot Point R2 | 0.6139 |
| Daily Pivot Point R3 | 0.6167 |
[/s2If]
Nehcap Expert Advisor
The NEHCAP MT4 EA is high quality professional trading system geared to generate returns without using GRID or martingales. Each trade has strict risk per trade parameter. The pairs under management include EURUSD, GBPUSD, AUDCAD, AUDNZD,GBPAUD, EURAUD, EURCAD, CHFJPY and many more.
The system is trading live: LIVE ACCOUNT TRACKING
You can run it free. Apply for a free trial and track our account. Buy the system or use profit share mechanism to generate returns on your MT4.
Join Our Telegram Group
")


