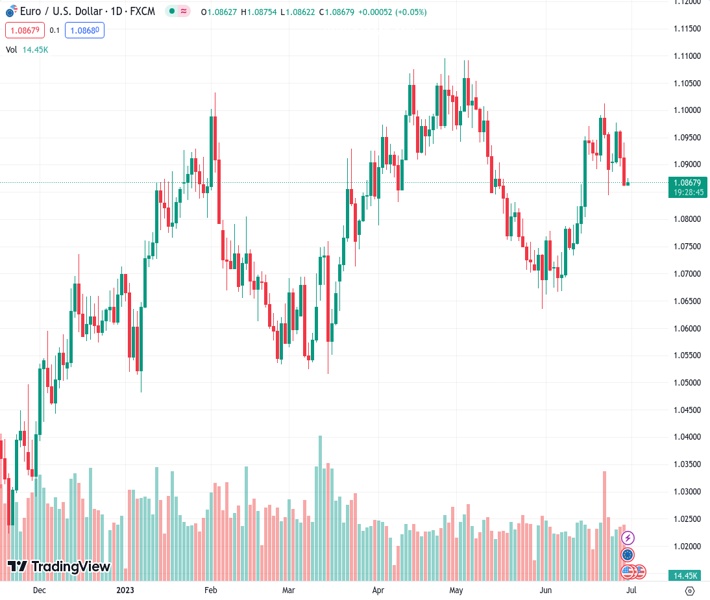
The currency pair EUR/USD, currently at a value of 1.08699, has experienced a second reversal from the 50-day Exponential Moving Average (EMA) within a week, indicating a continuation of its downward trend from two weeks ago. According to the perspective of @nehcap, only a small recovery is anticipated.
…
This is a premium post.
[s2If !current_user_can(access_s2member_level4)]Please register for FREE REGISTER to read full post below containing analysis. In case of any error or you think you are not able to read the full post below, please email us at support#nehcap.com [lwa][/s2If] [s2If current_user_can(access_s2member_level1)]
- EUR/USD prints the second U-turn from 50-EMA in a week to prod fortnight-old downward trajectory.
The pair currently trades last at 1.08699.
The previous day high was 1.0941 while the previous day low was 1.086. The daily 38.2% Fib levels comes at 1.0891, expected to provide resistance. Similarly, the daily 61.8% fib level is at 1.091, expected to provide resistance.
EUR/USD portrays the typical pre-data consolidation around 1.0875 as it prints the first daily gains in three amid early Friday. In doing so, the Euro pair bounces off the 50-Exponential Moving Average (EMA) support for the second time in the last one week as traders prepare for the first readings of Eurozone inflation for June and the Federal Reserve’s (Fed) favorite inflation gauge, namely the US Core Personal Consumption Expenditure (PCE) Price Index, for May.
Also read: EUR/USD steadies below 1.0900 as Fed hawks, US data supersede ECB optimists, EU/US inflation clues eyed
Although the key EMA defends Euro buyers around 1.0850, the looming bear cross on the MACD and a one-week-old descending resistance line, around 1.0940 at the latest, challenge the major currency pair’s immediate upside.
Even if the EUR/USD pair buyers manage to cross the 1.0940 hurdle, the 23.6% Fibonacci retracement of the March-April upside and the monthly high, respectively near 1.0960 and 1.1015, could challenge the upside before giving control to the bulls.
Meanwhile, a downside break of the 50-EMA support of near 1.0850 could quickly drag the EUR/USD price to the 1.0800 support confluence comprising the 100-EMA and 50% Fibonacci retracement
Following that, the 61.8% Fibonacci retracement and a three-month-old rising support line, near 1.0735 and 1.0715 in that order, will be in the spotlight.
Trend: Limited recovery expected
Technical Levels: Supports and Resistances
EURUSD currently trading at 1.0872 at the time of writing. Pair opened at 1.0868 and is trading with a change of 0.04% % .
| Overview | Overview.1 | |
|---|---|---|
| 0 | Today last price | 1.0872 |
| 1 | Today Daily Change | 0.0004 |
| 2 | Today Daily Change % | 0.04% |
| 3 | Today daily open | 1.0868 |
The pair is trading above its 20 Daily moving average @ 1.0847, below its 50 Daily moving average @ 1.0873 , above its 100 Daily moving average @ 1.0817 and above its 200 Daily moving average @ 1.0585
| Trends | Trends.1 | |
|---|---|---|
| 0 | Daily SMA20 | 1.0847 |
| 1 | Daily SMA50 | 1.0873 |
| 2 | Daily SMA100 | 1.0817 |
| 3 | Daily SMA200 | 1.0585 |
The previous day high was 1.0941 while the previous day low was 1.086. The daily 38.2% Fib levels comes at 1.0891, expected to provide resistance. Similarly, the daily 61.8% fib level is at 1.091, expected to provide resistance.
Note the levels of interest below:
- Pivot support is noted at 1.0839, 1.0809, 1.0758
- Pivot resistance is noted at 1.092, 1.0971, 1.1001
| Levels | Levels.1 |
|---|---|
| Previous Daily High | 1.0941 |
| Previous Daily Low | 1.0860 |
| Previous Weekly High | 1.1012 |
| Previous Weekly Low | 1.0844 |
| Previous Monthly High | 1.1092 |
| Previous Monthly Low | 1.0635 |
| Daily Fibonacci 38.2% | 1.0891 |
| Daily Fibonacci 61.8% | 1.0910 |
| Daily Pivot Point S1 | 1.0839 |
| Daily Pivot Point S2 | 1.0809 |
| Daily Pivot Point S3 | 1.0758 |
| Daily Pivot Point R1 | 1.0920 |
| Daily Pivot Point R2 | 1.0971 |
| Daily Pivot Point R3 | 1.1001 |
[/s2If]
Nehcap Expert Advisor
The NEHCAP MT4 EA is high quality professional trading system geared to generate returns without using GRID or martingales. Each trade has strict risk per trade parameter. The pairs under management include EURUSD, GBPUSD, AUDCAD, AUDNZD,GBPAUD, EURAUD, EURCAD, CHFJPY and many more.
The system is trading live: LIVE ACCOUNT TRACKING
You can run it free. Apply for a free trial and track our account. Buy the system or use profit share mechanism to generate returns on your MT4.
Join Our Telegram Group
")


