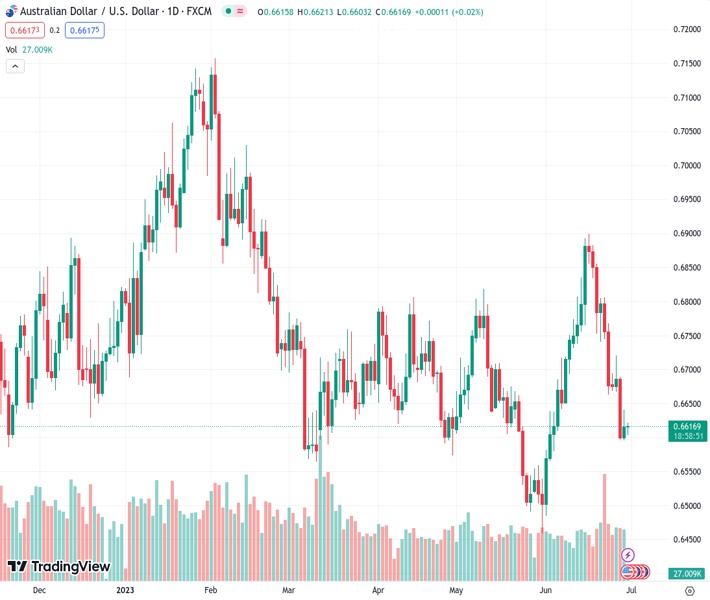
The AUDUSD currency pair declined slightly on Friday and remains close to a low that was reached earlier in the week.
…
This is a premium post.
[s2If !current_user_can(access_s2member_level4)]Please register for FREE REGISTER to read full post below containing analysis. In case of any error or you think you are not able to read the full post below, please email us at support#nehcap.com [lwa][/s2If] [s2If current_user_can(access_s2member_level1)]
- AUD/USD edges lower on Friday and hangs near a multi-week low touched the previous day.
The pair currently trades last at 0.66130.
The previous day high was 0.6641 while the previous day low was 0.6595. The daily 38.2% Fib levels comes at 0.6623, expected to provide resistance. Similarly, the daily 61.8% fib level is at 0.6613, expected to provide resistance.
The AUD/USD pair struggles to capitalize on the previous day’s modest gains and meets with some supply during the Asian session on Friday. Spot prices remain on the defensive around the 0.6600 mark, just above a nearly four-week low touched on Thursday and move little in reaction to the mixed Chinese macro data.
In fact, the official Chinese Manufacturing PMI remained in contraction territory for the third straight month and improves slightly to 49 for June, from 48.8 in the previous month. Meanwhile, the gauge for the services sector surpassed consensus estimates and came in at 53.2 for the reported month, though was lower than the 54.5 in May. The data does little to ease concerns about the worsening global economic outlook, which, along with concerns about deteriorating US-China relations, act as a headwind for the risk-sensitive Aussie.
Apart from this, expectations that the Reserve Bank of Australia (RBA) will refrain from hiking interest rates in July, bolstered by the fact that domestic consumer inflation slowed to a 13-month low in May, exert some pressure on the AUD/USD pair. The US Dollar (USD), on the other hand, stands tall near its highest level since June 13 and continues to draw support from the Federal Reserve’s (Fed) hawkish outlook. Moreover, the upbeat US economic data released on Thursday reaffirmed bets for another 25 bps lift-off at the July FOMC policy meeting.
This, in turn, remains supportive of elevated US Treasury bond yields and acts as a tailwind for the USD. Traders, however, seem reluctant to place aggressive bets and prefer to wait on the sidelines ahead of the release of the US Core PCE Price Index – the Fed’s preferred inflation gauge. The crucial data is due later during the early North American session and will influence expectations about the future rate-hike path. This, in turn, will drive the USD demand in the near term and provide a fresh directional impetus to the AUD/USD pair.
Technical Levels: Supports and Resistances
AUDUSD currently trading at 0.6616 at the time of writing. Pair opened at 0.6616 and is trading with a change of 0.0 % .
| Overview | Overview.1 | |
|---|---|---|
| 0 | Today last price | 0.6616 |
| 1 | Today Daily Change | 0.0000 |
| 2 | Today Daily Change % | 0.0000 |
| 3 | Today daily open | 0.6616 |
The pair remains strongly bearish on the daily time frame. It trades below the 20 SMA @ 0.6726, 50 SMA 0.6674, 100 SMA @ 0.6703 and 200 SMA @ 0.6692.
| Trends | Trends.1 | |
|---|---|---|
| 0 | Daily SMA20 | 0.6726 |
| 1 | Daily SMA50 | 0.6674 |
| 2 | Daily SMA100 | 0.6703 |
| 3 | Daily SMA200 | 0.6692 |
The previous day high was 0.6641 while the previous day low was 0.6595. The daily 38.2% Fib levels comes at 0.6623, expected to provide resistance. Similarly, the daily 61.8% fib level is at 0.6613, expected to provide resistance.
Note the levels of interest below:
- Pivot support is noted at 0.6594, 0.6572, 0.6549
- Pivot resistance is noted at 0.664, 0.6663, 0.6685
| Levels | Levels.1 |
|---|---|
| Previous Daily High | 0.6641 |
| Previous Daily Low | 0.6595 |
| Previous Weekly High | 0.6886 |
| Previous Weekly Low | 0.6663 |
| Previous Monthly High | 0.6818 |
| Previous Monthly Low | 0.6458 |
| Daily Fibonacci 38.2% | 0.6623 |
| Daily Fibonacci 61.8% | 0.6613 |
| Daily Pivot Point S1 | 0.6594 |
| Daily Pivot Point S2 | 0.6572 |
| Daily Pivot Point S3 | 0.6549 |
| Daily Pivot Point R1 | 0.6640 |
| Daily Pivot Point R2 | 0.6663 |
| Daily Pivot Point R3 | 0.6685 |
[/s2If]
Nehcap Expert Advisor
The NEHCAP MT4 EA is high quality professional trading system geared to generate returns without using GRID or martingales. Each trade has strict risk per trade parameter. The pairs under management include EURUSD, GBPUSD, AUDCAD, AUDNZD,GBPAUD, EURAUD, EURCAD, CHFJPY and many more.
The system is trading live: LIVE ACCOUNT TRACKING
You can run it free. Apply for a free trial and track our account. Buy the system or use profit share mechanism to generate returns on your MT4.
Join Our Telegram Group
")


