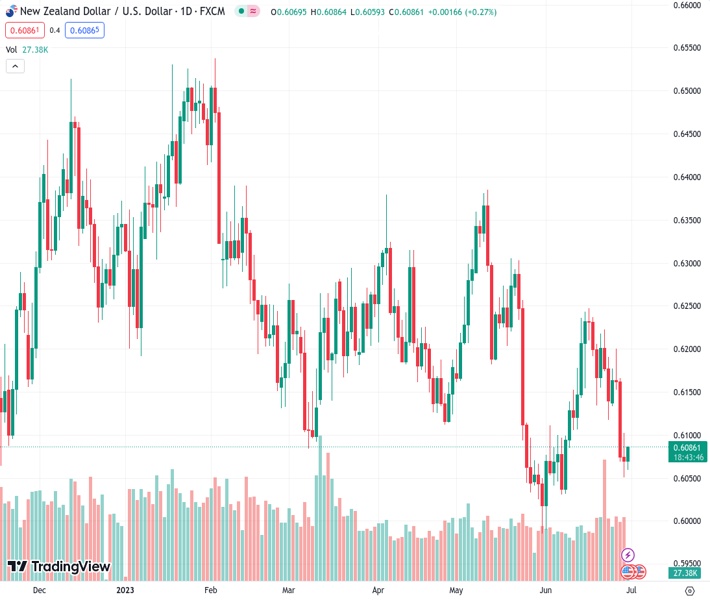
NZDUSD is currently stagnant at 0.60838, staying at its lowest point in three weeks, and showing a slight downward trend over the past three days.
…
This is a premium post.
[s2If !current_user_can(access_s2member_level4)]Please register for FREE REGISTER to read full post below containing analysis. In case of any error or you think you are not able to read the full post below, please email us at support#nehcap.com [lwa][/s2If] [s2If current_user_can(access_s2member_level1)]
- NZD/USD remains sidelined at the lowest levels in three weeks, prods three-day downtrend.
The pair currently trades last at 0.60838.
The previous day high was 0.6112 while the previous day low was 0.605. The daily 38.2% Fib levels comes at 0.6074, expected to provide support. Similarly, the daily 61.8% fib level is at 0.6088, expected to provide resistance.
NZD/USD bears take a breather near the multi-day low as mixed data from China joins upbeat economic signals at home to prod further downside during early Friday. Also challenging the Kiwi bears is the cautious mood ahead of the key US inflation gauge. That said, the Kiwi pair picks up bids to 0.6075 as it prints the first daily gain, of 0.05% intraday at the latest, in four as we write.
China’s headline NBS Manufacturing PMI matches 49.0 market forecasts in June versus 48.8 expected while the Non-Manufacturing PMI rose past 50.2 analysts’ estimations to 53.2, compared to 54.5 previous readings, during the said month.
On the other hand, New Zealand’s ANZ – Roy Morgan Consumer Confidence for June jumped to 85.5 versus 79.2 prior release.
It’s worth noting that the early-week disappointment from Australia’s inflation data contrasts with the Pacific major’s upbeat Retail Sales to also prod the NZD/USD bears, due to Auckland’s ties with Canberra.
Even so, hawkish Federal Reserve (Fed) comments and upbeat US data keep the US Dollar firmer and exert downside pressure on the Kiwi pair amid a light calendar at home and fears of the Reserve Bank of New Zealand’s (RBNZ) pause in rate hike.
During the week, Fed Chair Jerome Powell advocated for two more rate hikes in 2023 while Atlanta Federal Reserve President Raphael Bostic flashed mixed signals but stayed hawkish overall. Talking about the US data, the final readings of the Gross Domestic Product (GDP) Annualized, mostly known as the Real GDP, grew at the 2.0% rate for the first quarter (Q1) of 2023 versus the 1.3% initial estimation. Further, the US Weekly Initial Jobless Claims slumped to 239K for the week ended on June 23 compared to 265K expected and revised prior. However, the Personal Consumption Expenditure (PCE) Price for Q1 2023 eased to 4.1% QoQ from 4.2% expected and prior whereas the Pending Home Sales slumped to -2.7% MoM for May compared to 0.2% expected and -0.4% prior (revised).
Amid these plays, the markets remain dicey after witnessing an upbeat day, which in turn challenges the NZD/USD traders ahead of the Federal Reserve’s (Fed) favorite inflation gauge, namely the US Core Personal Consumption Expenditure (PCE) Price Index, for May.
The oversold RSI (14) line and the receding bearish bias of the MACD signals prod the NZD/USD bears of late. However, the Kiwi pair’s sustained downside break of the monthly support line, 100-SMA and a two-week-old bearish channel keeps the sellers hopeful. Hence, a horizontal area comprising multiple levels marked since late May, around 0.6030, can allow the NZD/USD prices to consolidate before marking the fresh leg towards the south.
Technical Levels: Supports and Resistances
NZDUSD currently trading at 0.6075 at the time of writing. Pair opened at 0.607 and is trading with a change of 0.08 % .
| Overview | Overview.1 | |
|---|---|---|
| 0 | Today last price | 0.6075 |
| 1 | Today Daily Change | 0.0005 |
| 2 | Today Daily Change % | 0.0800 |
| 3 | Today daily open | 0.6070 |
The pair remains strongly bearish on the daily time frame. It trades below the 20 SMA @ 0.6138, 50 SMA 0.6167, 100 SMA @ 0.6197 and 200 SMA @ 0.616.
| Trends | Trends.1 | |
|---|---|---|
| 0 | Daily SMA20 | 0.6138 |
| 1 | Daily SMA50 | 0.6167 |
| 2 | Daily SMA100 | 0.6197 |
| 3 | Daily SMA200 | 0.6160 |
The previous day high was 0.6112 while the previous day low was 0.605. The daily 38.2% Fib levels comes at 0.6074, expected to provide support. Similarly, the daily 61.8% fib level is at 0.6088, expected to provide resistance.
Note the levels of interest below:
- Pivot support is noted at 0.6043, 0.6015, 0.5981
- Pivot resistance is noted at 0.6105, 0.6139, 0.6167
| Levels | Levels.1 |
|---|---|
| Previous Daily High | 0.6112 |
| Previous Daily Low | 0.6050 |
| Previous Weekly High | 0.6237 |
| Previous Weekly Low | 0.6116 |
| Previous Monthly High | 0.6385 |
| Previous Monthly Low | 0.5985 |
| Daily Fibonacci 38.2% | 0.6074 |
| Daily Fibonacci 61.8% | 0.6088 |
| Daily Pivot Point S1 | 0.6043 |
| Daily Pivot Point S2 | 0.6015 |
| Daily Pivot Point S3 | 0.5981 |
| Daily Pivot Point R1 | 0.6105 |
| Daily Pivot Point R2 | 0.6139 |
| Daily Pivot Point R3 | 0.6167 |
[/s2If]
Nehcap Expert Advisor
The NEHCAP MT4 EA is high quality professional trading system geared to generate returns without using GRID or martingales. Each trade has strict risk per trade parameter. The pairs under management include EURUSD, GBPUSD, AUDCAD, AUDNZD,GBPAUD, EURAUD, EURCAD, CHFJPY and many more.
The system is trading live: LIVE ACCOUNT TRACKING
You can run it free. Apply for a free trial and track our account. Buy the system or use profit share mechanism to generate returns on your MT4.
Join Our Telegram Group
")


