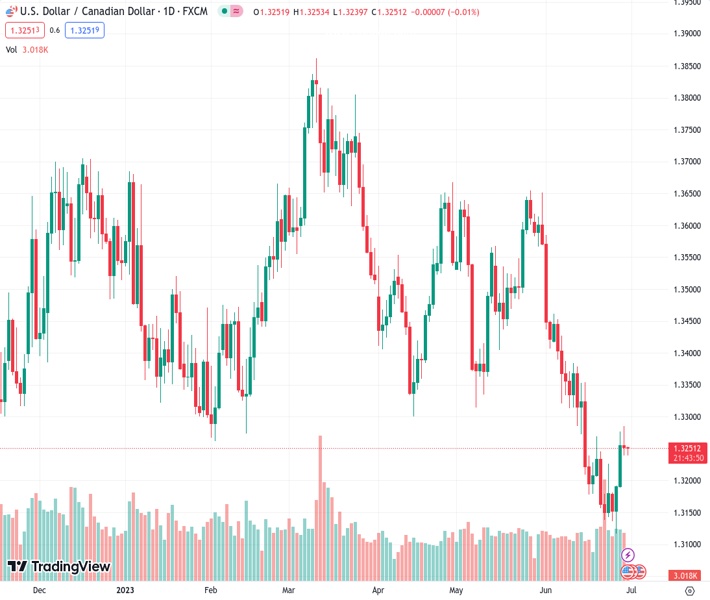
The US dollar experienced small losses despite being driven by positive GDP and jobless claims data, with the USDCAD currency pair trading at a rate of 1.32490.
…
This is a premium post.
[s2If !current_user_can(access_s2member_level4)]Please register for FREE REGISTER to read full post below containing analysis. In case of any error or you think you are not able to read the full post below, please email us at support#nehcap.com [lwa][/s2If] [s2If current_user_can(access_s2member_level1)]
- Strong GDP and jobless claims data drive US Dollar, yet USD/CAD records marginal losses.
The pair currently trades last at 1.32490.
The previous day high was 1.3276 while the previous day low was 1.3189. The daily 38.2% Fib levels comes at 1.3243, expected to provide support. Similarly, the daily 61.8% fib level is at 1.3223, expected to provide support.
USD/CAD registered minuscule losses on Thursday in a session that witnessed the US Dollar (USD) as the strongest currency, which rose on better-than-expected US economic data which failed to boost the USD/CAD. The USD/CAD is trading at 1.3249 after hitting a high of 1.3285.
Key economic indicators of the US economy pushed aside recession fears that reignited during the last week. The US Gross Domestic Product (GDP) for the first quarter exceeded the prior’s reading of 1.3%, climbed past the 2% market, crushing estimates, sending US Treasury bond yields soaring more than ten basis points. Additional data revealed the tightness of the labor market, as Initial Jobless Claims for the week ending June 24 climbed by 239K, below forecasts of 265K, and halted three weeks of rising unemployment claims, suggesting the labor market remains solid, ahead of the following week’s June Nonfarm Payrolls report.
As abovementioned, the US 2-year Treasury bond yield surged toward the 4.9% threshold, while the 10-year note rate, which finished at 3.842%, gained 13 basis points. The US Dollar Index (DXY), a measure of the greenback’s value against a basket of peers, advanced 0.33%, up at 103.302.
Following a robust performance by the US economy over the past month, speculation regarding further monetary policy tightening by the US Federal Reserve (Fed) has increased. In his recent discourse during the Eurozone session, Fed Chair Jerome Powell underscored the consensus of the Federal Reserve Open Market Committee (FOMC) regarding the probable implementation of two more rate hikes by the close of the year.
Odds for a 25 bps rate hike in July increased to 87%, while traders shifted their view of only one rate increase as chances for the November meeting augmented to 33.7%, according to the CME FedWatch Tool.
On the Canadian front, the economic agenda was absent on Thursday. Still, data expected on Friday, like the Gross Domestic Product (GDP) and the Bank of Canada outlook survey, will shed some light on the economic status of Canada. The Core Personal Consumption Expenditures (PCE) would be featured alongside the Consumer Sentiment and the Chicago PMI on the US front.
Technical Levels: Supports and Resistances
USDCAD currently trading at 1.3252 at the time of writing. Pair opened at 1.3257 and is trading with a change of -0.04 % .
| Overview | Overview.1 | |
|---|---|---|
| 0 | Today last price | 1.3252 |
| 1 | Today Daily Change | -0.0005 |
| 2 | Today Daily Change % | -0.0400 |
| 3 | Today daily open | 1.3257 |
The pair remains strongly bearish on the daily time frame. It trades below the 20 SMA @ 1.3288, 50 SMA 1.3433, 100 SMA @ 1.3498 and 200 SMA @ 1.3517.
| Trends | Trends.1 | |
|---|---|---|
| 0 | Daily SMA20 | 1.3288 |
| 1 | Daily SMA50 | 1.3433 |
| 2 | Daily SMA100 | 1.3498 |
| 3 | Daily SMA200 | 1.3517 |
The previous day high was 1.3276 while the previous day low was 1.3189. The daily 38.2% Fib levels comes at 1.3243, expected to provide support. Similarly, the daily 61.8% fib level is at 1.3223, expected to provide support.
Note the levels of interest below:
- Pivot support is noted at 1.3205, 1.3154, 1.3118
- Pivot resistance is noted at 1.3292, 1.3328, 1.338
| Levels | Levels.1 |
|---|---|
| Previous Daily High | 1.3276 |
| Previous Daily Low | 1.3189 |
| Previous Weekly High | 1.3270 |
| Previous Weekly Low | 1.3139 |
| Previous Monthly High | 1.3655 |
| Previous Monthly Low | 1.3315 |
| Daily Fibonacci 38.2% | 1.3243 |
| Daily Fibonacci 61.8% | 1.3223 |
| Daily Pivot Point S1 | 1.3205 |
| Daily Pivot Point S2 | 1.3154 |
| Daily Pivot Point S3 | 1.3118 |
| Daily Pivot Point R1 | 1.3292 |
| Daily Pivot Point R2 | 1.3328 |
| Daily Pivot Point R3 | 1.3380 |
[/s2If]
Nehcap Expert Advisor
The NEHCAP MT4 EA is high quality professional trading system geared to generate returns without using GRID or martingales. Each trade has strict risk per trade parameter. The pairs under management include EURUSD, GBPUSD, AUDCAD, AUDNZD,GBPAUD, EURAUD, EURCAD, CHFJPY and many more.
The system is trading live: LIVE ACCOUNT TRACKING
You can run it free. Apply for a free trial and track our account. Buy the system or use profit share mechanism to generate returns on your MT4.
Join Our Telegram Group
")


