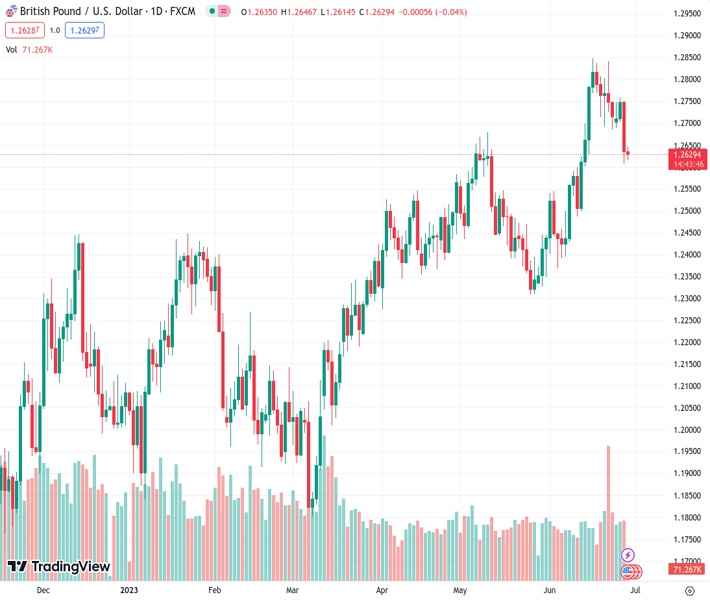
The GBPUSD pair is currently experiencing downward pressure and is trading at its lowest level in two weeks, flirting with a support line that has been rising for the past five weeks.
…
This is a premium post.
[s2If !current_user_can(access_s2member_level4)]Please register for FREE REGISTER to read full post below containing analysis. In case of any error or you think you are not able to read the full post below, please email us at support#nehcap.com [lwa][/s2If] [s2If current_user_can(access_s2member_level1)]
- GBP/USD remains pressured at the lowest level in a fortnight, poking five-week-old rising support.
The pair currently trades last at 1.26309.
The previous day high was 1.2753 while the previous day low was 1.2606. The daily 38.2% Fib levels comes at 1.2662, expected to provide resistance. Similarly, the daily 61.8% fib level is at 1.2697, expected to provide resistance.
GBP/USD drills the 15-day low around 1.2620 heading into Thursday’s London open. In doing so, the Cable pair traders pay little reaction to comments from Bank of England (BoE) Governor Andrew Bailey than Federal Reserve (Fed) Chairman Jerome Powell.
The reason for more preference for Fed Chair Powell’s speech as the key catalyst could be linked to the comparatively stronger economic conditions in the UK than in the US. Additionally, the upbeat outcome of the US Banking Stress Test also emphasizes the US Dollar strength.
That said, Bank of England (BoE) Govern Andrew Bailey showed readiness to do what was necessary to get inflation to target. The policymaker also said, “Data showed clear signs of persistence of inflation,” suggesting further rate hikes from the “Old Lady”, as the BoE is informally called.
On the other hand, Federal Reserve (Fed) Chairman Jerome Powell said, “We believe there’s more restriction coming, driven by the labor market.” The policymaker also ruled out the economic downturn as the most likely case.
Elsewhere, the Fed’s ‘stress test’ exercise showed lenders, including JPMorgan Chase, Bank of America, Citigroup, Wells Fargo, Morgan Stanley and Goldman Sachs, have enough capital to weather a severe economic slump, paving the way for them to issue share buybacks and dividends,” reported Reuters.
It should be noted that the mixed headlines about the US-China ties as US Treasury Secretary Janet Yellen ‘hopes’ to visit China to re-establish contacts but also showed readiness to take actions to protect national security interests even at economic cost add strength to the US Dollar and weigh on the USD Dollar, via challenges to sentiment.
Amid these plays, S&P500 Futures lack clear directions after rising in the last two days. Further, the US 10-year and two-year Treasury bond yields consolidate the previous day’s losses around 3.48% and 4.75% at the latest.
Looking forward, Fed Chair Powell’s speech and the revised version of the US Gross Domestic Product (GDP) for the first quarter (Q1) 2023, as well as the second-tier US employment and activity data, will be important to watch for clear directions.
Daily closing beyond a five-week-old rising support line, around 1.2620, as well as a clear downside break of the 1.2600 round figure becomes necessary for the GBP/USD bears to keep the reins.
On the contrary, the Cable pair’s recovery needs validation from 21-day Exponential Moving Average (EMA), close to 1.2645 by the press time.
Technical Levels: Supports and Resistances
GBPUSD currently trading at 1.2626 at the time of writing. Pair opened at 1.2635 and is trading with a change of -0.07% % .
| Overview | Overview.1 | |
|---|---|---|
| 0 | Today last price | 1.2626 |
| 1 | Today Daily Change | -0.0009 |
| 2 | Today Daily Change % | -0.07% |
| 3 | Today daily open | 1.2635 |
The pair is trading below its 20 Daily moving average @ 1.2635, above its 50 Daily moving average @ 1.254 , above its 100 Daily moving average @ 1.2368 and above its 200 Daily moving average @ 1.2096
| Trends | Trends.1 | |
|---|---|---|
| 0 | Daily SMA20 | 1.2635 |
| 1 | Daily SMA50 | 1.2540 |
| 2 | Daily SMA100 | 1.2368 |
| 3 | Daily SMA200 | 1.2096 |
The previous day high was 1.2753 while the previous day low was 1.2606. The daily 38.2% Fib levels comes at 1.2662, expected to provide resistance. Similarly, the daily 61.8% fib level is at 1.2697, expected to provide resistance.
Note the levels of interest below:
- Pivot support is noted at 1.2577, 1.2519, 1.2431
- Pivot resistance is noted at 1.2723, 1.2811, 1.2869
| Levels | Levels.1 |
|---|---|
| Previous Daily High | 1.2753 |
| Previous Daily Low | 1.2606 |
| Previous Weekly High | 1.2845 |
| Previous Weekly Low | 1.2685 |
| Previous Monthly High | 1.2680 |
| Previous Monthly Low | 1.2308 |
| Daily Fibonacci 38.2% | 1.2662 |
| Daily Fibonacci 61.8% | 1.2697 |
| Daily Pivot Point S1 | 1.2577 |
| Daily Pivot Point S2 | 1.2519 |
| Daily Pivot Point S3 | 1.2431 |
| Daily Pivot Point R1 | 1.2723 |
| Daily Pivot Point R2 | 1.2811 |
| Daily Pivot Point R3 | 1.2869 |
[/s2If]
Nehcap Expert Advisor
The NEHCAP MT4 EA is high quality professional trading system geared to generate returns without using GRID or martingales. Each trade has strict risk per trade parameter. The pairs under management include EURUSD, GBPUSD, AUDCAD, AUDNZD,GBPAUD, EURAUD, EURCAD, CHFJPY and many more.
The system is trading live: LIVE ACCOUNT TRACKING
You can run it free. Apply for a free trial and track our account. Buy the system or use profit share mechanism to generate returns on your MT4.
Join Our Telegram Group
")


