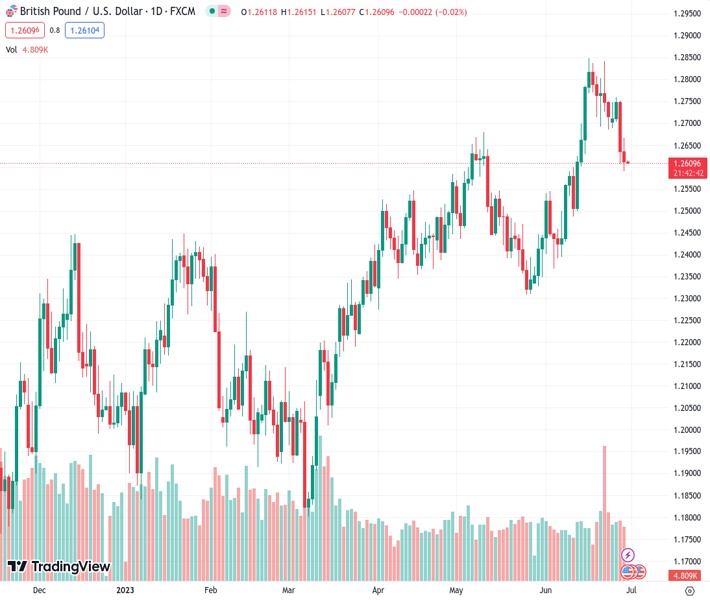
The GBPUSD pair, currently trading at the level of 1.26103, fluctuates near its lowest levels in the past two weeks and continues to follow a downward trend over the last two days. According to the viewpoint of @nehcap, it is anticipated that there will be more downward movement in the future.
…
This is a premium post.
[s2If !current_user_can(access_s2member_level4)]Please register for FREE REGISTER to read full post below containing analysis. In case of any error or you think you are not able to read the full post below, please email us at support#nehcap.com [lwa][/s2If] [s2If current_user_can(access_s2member_level1)]
- GBP/USD seesaws around the lowest levels in two weeks, prods two-day downtrend of late.
The pair currently trades last at 1.26103.
The previous day high was 1.2753 while the previous day low was 1.2606. The daily 38.2% Fib levels comes at 1.2662, expected to provide resistance. Similarly, the daily 61.8% fib level is at 1.2697, expected to provide resistance.
GBP/USD treads water at the lowest levels in two weeks, around 1.2610-1.2600 amid early Friday morning in Asia. In doing so, the Cable pair fails to justify the midweek’s downside break of the key horizontal support, now resistance, as well as the bearish MACD signals.
The Pound Sterling’s latest inaction could be linked to the market’s cautious mood ahead of the top-tier US and UK data, as well as the presence of ascending support lines from March and May, as well as the steady RSI (14) line.
Hence, the GBP/USD pair is likely to grind lower and suggests a battle with the ascending support line from March 08, around 1.2565, to be imminent.
The Pound Sterling’s weakness past 1.2565, however, isn’t an open invitation to the GBP/USD bears as a five-week-old rising support line, close to 1.2525, will precede the 100-day Exponential Moving Average (EMA), around 1.2420, to restrict further downside of the pair.
Meanwhile, the GBP/USD pair’s corrective bounce past the horizontal area comprising multiple levels marked since early May, between 1.2670 and 1.2690, appears a tough nut to crack for the Cable pair buyers during the corrective bounce.
In a case where the GBP/USD manages to remain firmer past 1.2690, the odds of witnessing a rally towards the yearly top marked in mid-June around 1.2850 can’t be ruled out.
Trend: Further downside expected
Technical Levels: Supports and Resistances
GBPUSD currently trading at 1.2612 at the time of writing. Pair opened at 1.2635 and is trading with a change of -0.18% % .
| Overview | Overview.1 | |
|---|---|---|
| 0 | Today last price | 1.2612 |
| 1 | Today Daily Change | -0.0023 |
| 2 | Today Daily Change % | -0.18% |
| 3 | Today daily open | 1.2635 |
The pair is trading below its 20 Daily moving average @ 1.2635, above its 50 Daily moving average @ 1.254 , above its 100 Daily moving average @ 1.2368 and above its 200 Daily moving average @ 1.2096
| Trends | Trends.1 | |
|---|---|---|
| 0 | Daily SMA20 | 1.2635 |
| 1 | Daily SMA50 | 1.2540 |
| 2 | Daily SMA100 | 1.2368 |
| 3 | Daily SMA200 | 1.2096 |
The previous day high was 1.2753 while the previous day low was 1.2606. The daily 38.2% Fib levels comes at 1.2662, expected to provide resistance. Similarly, the daily 61.8% fib level is at 1.2697, expected to provide resistance.
Note the levels of interest below:
- Pivot support is noted at 1.2577, 1.2519, 1.2431
- Pivot resistance is noted at 1.2723, 1.2811, 1.2869
| Levels | Levels.1 |
|---|---|
| Previous Daily High | 1.2753 |
| Previous Daily Low | 1.2606 |
| Previous Weekly High | 1.2845 |
| Previous Weekly Low | 1.2685 |
| Previous Monthly High | 1.2680 |
| Previous Monthly Low | 1.2308 |
| Daily Fibonacci 38.2% | 1.2662 |
| Daily Fibonacci 61.8% | 1.2697 |
| Daily Pivot Point S1 | 1.2577 |
| Daily Pivot Point S2 | 1.2519 |
| Daily Pivot Point S3 | 1.2431 |
| Daily Pivot Point R1 | 1.2723 |
| Daily Pivot Point R2 | 1.2811 |
| Daily Pivot Point R3 | 1.2869 |
[/s2If]
Nehcap Expert Advisor
The NEHCAP MT4 EA is high quality professional trading system geared to generate returns without using GRID or martingales. Each trade has strict risk per trade parameter. The pairs under management include EURUSD, GBPUSD, AUDCAD, AUDNZD,GBPAUD, EURAUD, EURCAD, CHFJPY and many more.
The system is trading live: LIVE ACCOUNT TRACKING
You can run it free. Apply for a free trial and track our account. Buy the system or use profit share mechanism to generate returns on your MT4.
Join Our Telegram Group
")


