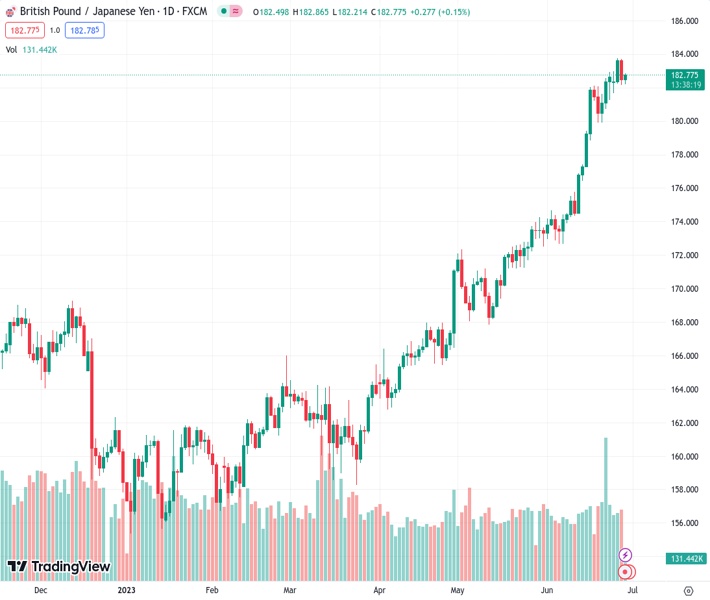
The GBPJPY pair, currently at 182.815, has reduced its gains this week, although it remains at its highest levels since December 2015. It has started to attract buyers to reverse its earlier decline. According to the perspective of @nehcap, it is anticipated that there will be a continuation of the recovery.
…
This is a premium post.
[s2If !current_user_can(access_s2member_level4)]Please register for FREE REGISTER to read full post below containing analysis. In case of any error or you think you are not able to read the full post below, please email us at support#nehcap.com [lwa][/s2If] [s2If current_user_can(access_s2member_level1)]
- GBP/JPY pares weekly gains at the highest levels since December 2015, picks up bids to reverse early-day downside of late.
The pair currently trades last at 182.815.
The previous day high was 183.72 while the previous day low was 182.15. The daily 38.2% Fib levels comes at 182.75, expected to provide support. Similarly, the daily 61.8% fib level is at 183.12, expected to provide resistance.
GBP/JPY regains the 182.60 level as it consolidates the intraday losses heading into Thursday’s London open. In doing so, the cross-currency pair prints mild gain at the highest levels since late 2015, losing upside momentum of late.
That said, Wednesday’s rejection of a one-week-old bullish channel joins the bearish MACD signals to lure short-term GBP/JPY sellers.
However, multiple tops marked since June 18 join the 50-SMA to restrict the immediate downside of the pair around 182.00-182.10.
Even if the quote breaks the 182.00 support, a three-week-old rising trend line and the 100-SMA, respectively near 180.60 and 179.30, will challenge the GBP/JPY bears. Also acting as the downside filter is the 180.00 psychological magnet.
On the contrary, the pair’s latest recovery appears elusive unless defying the previous day’s channel break, by crossing the 183.000 hurdle comprising the lower line of the aforementioned channel.
Following that, a run-up towards the latest multi-year high near 183.80 and the stated channel’s top line, close to 184.50 could lure the GBP/JPY buyers.
It’s worth noting that the GBP/JPY pair’s run-up beyond 184.50 enables buyers to aim for the November 2015 peak of near 188.80 and then the 190.00 round figure.
Overall, GBP/JPY may remain depressed but the bears are far from home.
Trend: Further recovery expected
Technical Levels: Supports and Resistances
GBPJPY currently trading at 182.54 at the time of writing. Pair opened at 182.57 and is trading with a change of -0.02% % .
| Overview | Overview.1 | |
|---|---|---|
| 0 | Today last price | 182.54 |
| 1 | Today Daily Change | -0.03 |
| 2 | Today Daily Change % | -0.02% |
| 3 | Today daily open | 182.57 |
The pair remains strongly bullish on the daily timeframe. It trades above its 20 SMA @ 178.33, 50 SMA 173.55, 100 SMA @ 168.25 and 200 SMA @ 165.83.
| Trends | Trends.1 | |
|---|---|---|
| 0 | Daily SMA20 | 178.33 |
| 1 | Daily SMA50 | 173.55 |
| 2 | Daily SMA100 | 168.25 |
| 3 | Daily SMA200 | 165.83 |
The previous day high was 183.72 while the previous day low was 182.15. The daily 38.2% Fib levels comes at 182.75, expected to provide support. Similarly, the daily 61.8% fib level is at 183.12, expected to provide resistance.
Note the levels of interest below:
- Pivot support is noted at 181.91, 181.24, 180.33
- Pivot resistance is noted at 183.48, 184.39, 185.06
| Levels | Levels.1 |
|---|---|
| Previous Daily High | 183.72 |
| Previous Daily Low | 182.15 |
| Previous Weekly High | 182.95 |
| Previous Weekly Low | 179.92 |
| Previous Monthly High | 174.28 |
| Previous Monthly Low | 167.84 |
| Daily Fibonacci 38.2% | 182.75 |
| Daily Fibonacci 61.8% | 183.12 |
| Daily Pivot Point S1 | 181.91 |
| Daily Pivot Point S2 | 181.24 |
| Daily Pivot Point S3 | 180.33 |
| Daily Pivot Point R1 | 183.48 |
| Daily Pivot Point R2 | 184.39 |
| Daily Pivot Point R3 | 185.06 |
[/s2If]
Nehcap Expert Advisor
The NEHCAP MT4 EA is high quality professional trading system geared to generate returns without using GRID or martingales. Each trade has strict risk per trade parameter. The pairs under management include EURUSD, GBPUSD, AUDCAD, AUDNZD,GBPAUD, EURAUD, EURCAD, CHFJPY and many more.
The system is trading live: LIVE ACCOUNT TRACKING
You can run it free. Apply for a free trial and track our account. Buy the system or use profit share mechanism to generate returns on your MT4.
Join Our Telegram Group
")


