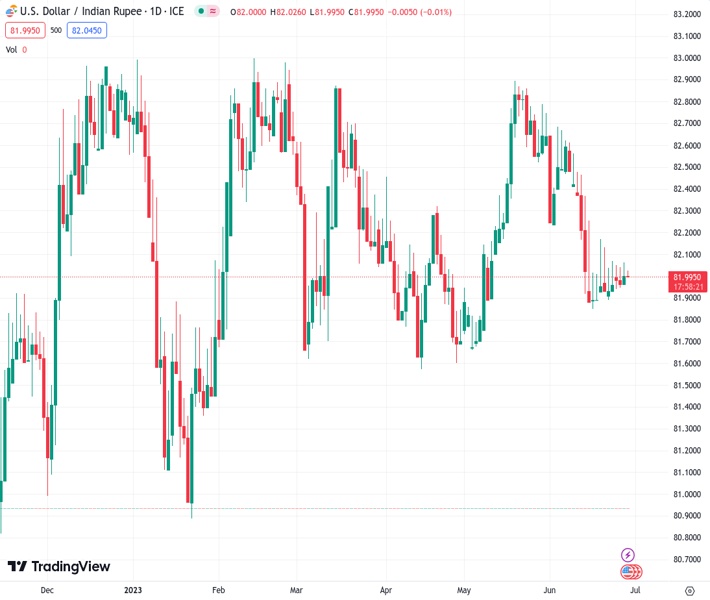
The currency pair USDINR is continuing to trade within a narrow range, with no significant upward or downward movement, for the past two weeks.
…
This is a premium post.
[s2If !current_user_can(access_s2member_level4)]Please register for FREE REGISTER to read full post below containing analysis. In case of any error or you think you are not able to read the full post below, please email us at support#nehcap.com [lwa][/s2If] [s2If current_user_can(access_s2member_level1)]
- USD/INR extends its sideways consolidative price move in a two-week-old trading range.
The pair currently trades last at 82.0150.
The previous day high was 82.103 while the previous day low was 81.9695. The daily 38.2% Fib levels comes at 82.052, expected to provide resistance. Similarly, the daily 61.8% fib level is at 82.0205, expected to provide resistance.
The USD/INR pair continues with its struggle to gain any meaningful traction and remains confined in a familiar trading band held over the past two weeks or so. Spot prices hold steady above the 82.00 mark through the Asian session on Thursday, though the technical setup seems tilted in favour of bearish traders.
The subdued/range-bound price move constitutes the formation of a rectangle on the daily chart. Against the backdrop of the recent pullback from the vicinity of the 83.00 mark, this might still be categorized as a bearish consolidation phase. Moreover, acceptance below the very important 200-day Simple Moving Average (SMA), for the first time since January 2022, suggests that the path of least resistance for the USD/INR pair is to the downside.
The negative outlook is reinforced by the fact that technical indicators on the daily chart are holding in the bearish territory and are still far from being in the oversold zone. That said, it will still be prudent to wait for a sustained break below the trading range support, around the 81.85 area, before positioning for any further downfall. The USD/INR pair might then slide to the 81.50 intermediate support before dropping to sub-81.00 levels or the YTD low.
On the flip side, the trading range resistance, around the 82.15 region, which coincides with the 200-day SMA, might continue to act as an immediate strong barrier. A sustained strength beyond could negate the negative outlook and trigger some near-term short-covering rally. The momentum could then lift the USD/INR pair back towards the 82.70-82.75 intermediate hurdle, above which bulls are likely to make a fresh attempt to conquer the 83.00 mark.
Technical Levels: Supports and Resistances
USDINR currently trading at 82.0515 at the time of writing. Pair opened at 82.0085 and is trading with a change of 0.05 % .
| Overview | Overview.1 | |
|---|---|---|
| 0 | Today last price | 82.0515 |
| 1 | Today Daily Change | 0.0430 |
| 2 | Today Daily Change % | 0.0500 |
| 3 | Today daily open | 82.0085 |
The pair remains strongly bearish on the daily time frame. It trades below the 20 SMA @ 82.1796, 50 SMA 82.2027, 100 SMA @ 82.2636 and 200 SMA @ 82.1421.
| Trends | Trends.1 | |
|---|---|---|
| 0 | Daily SMA20 | 82.1796 |
| 1 | Daily SMA50 | 82.2027 |
| 2 | Daily SMA100 | 82.2636 |
| 3 | Daily SMA200 | 82.1421 |
The previous day high was 82.103 while the previous day low was 81.9695. The daily 38.2% Fib levels comes at 82.052, expected to provide resistance. Similarly, the daily 61.8% fib level is at 82.0205, expected to provide resistance.
Note the levels of interest below:
- Pivot support is noted at 81.951, 81.8935, 81.8174
- Pivot resistance is noted at 82.0845, 82.1606, 82.2181
| Levels | Levels.1 |
|---|---|
| Previous Daily High | 82.1030 |
| Previous Daily Low | 81.9695 |
| Previous Weekly High | 82.1725 |
| Previous Weekly Low | 81.8845 |
| Previous Monthly High | 82.9810 |
| Previous Monthly Low | 81.6435 |
| Daily Fibonacci 38.2% | 82.0520 |
| Daily Fibonacci 61.8% | 82.0205 |
| Daily Pivot Point S1 | 81.9510 |
| Daily Pivot Point S2 | 81.8935 |
| Daily Pivot Point S3 | 81.8174 |
| Daily Pivot Point R1 | 82.0845 |
| Daily Pivot Point R2 | 82.1606 |
| Daily Pivot Point R3 | 82.2181 |
[/s2If]
Nehcap Expert Advisor
The NEHCAP MT4 EA is high quality professional trading system geared to generate returns without using GRID or martingales. Each trade has strict risk per trade parameter. The pairs under management include EURUSD, GBPUSD, AUDCAD, AUDNZD,GBPAUD, EURAUD, EURCAD, CHFJPY and many more.
The system is trading live: LIVE ACCOUNT TRACKING
You can run it free. Apply for a free trial and track our account. Buy the system or use profit share mechanism to generate returns on your MT4.
Join Our Telegram Group
")


