The currency pair GBPUSD, at a rate of 1.26196 BP/USD, experiences a decrease in value as a result of strong data from the US. This reinforces the argument for the Federal Reserve to implement more strict monetary policies and leads to an increase in Treasury bond yields.
…
This is a premium post.
[s2If !current_user_can(access_s2member_level4)]Please register for FREE REGISTER to read full post below containing analysis. In case of any error or you think you are not able to read the full post below, please email us at support#nehcap.com [lwa][/s2If] [s2If current_user_can(access_s2member_level1)]
- BP/USD dips following robust US data, bolstering the case for additional Federal Reserve tightening and higher Treasury bond yields.
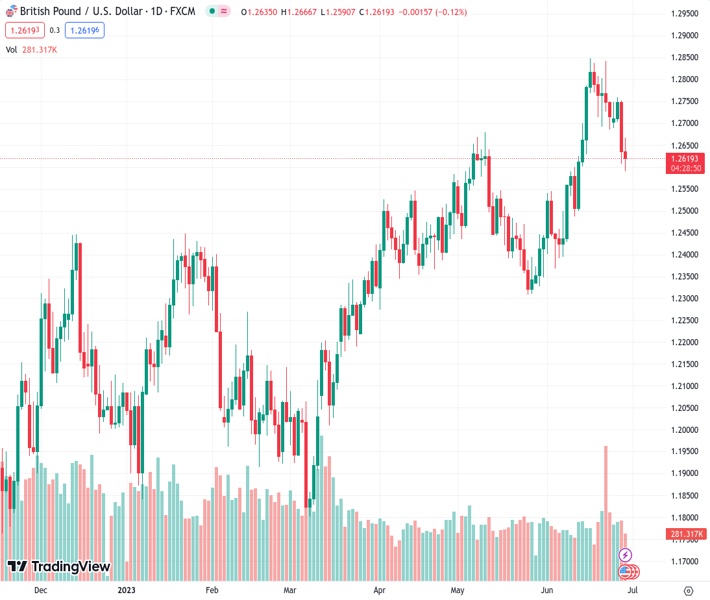
The pair currently trades last at 1.26196.
The previous day high was 1.2753 while the previous day low was 1.2606. The daily 38.2% Fib levels comes at 1.2662, expected to provide resistance. Similarly, the daily 61.8% fib level is at 1.2697, expected to provide resistance.
GBP/USD drops sharply in the North American session following the release of outstanding data in the United States (US), painting an optimistic economic outlook and cementing the case for additional tightening by the US Federal Reserve (Fed). Therefore, the greenback is rising, underpinned by elevated US Treasury bond yields. At the time of writing, the GBP/USD is trading at 1.2611, down 0.18%.
The US Dollar (USD) is the primary driver of the session as data continues to surprise market participants. The US’s Gross Domestic Product (GDP) was revised upwards to a 2% YoY advance, above estimates of 1.3%. At the same time, a measure of the jobs market, Initial Jobless Claims droppest the most in 20 months, to 239K, below estimates of 265K, which could trigger another hike by the Fed to cool demand.
After the data release, the GBP/USD tumbled from around 1.2660 towards the 1.2600 figure, extending its fall to a new two-week low of 12590. The buck strengthened as well as the US Treasury bond yields, with the 10-year benchmark note rate yielding 3.846%, gaining 14 basis points, reaching levels last seen in March 2023.
In the meantime, Fed Chair Jerome Powell crossed the wires and said the labor market remains tight, inflation too high, and expressed the Fed’s “long way to go” before inflation gets back to Fed’s 2% target. He added the majority of the Federal Reserve Open Market Committee (FOMC) expects “two or more” interest rate increases by the end of the year.
Other data showed that Pending Home Sales plunged to a five-month low in May, coming at -22.2% YoY, worst than April’s -20% contraction.
Aside from this, an empty UK economic docket left traders adrift to US Dollar dynamics, as well as market mood. Nevertheless, the Pound Sterling (GBP) weakened on comments by The Bank of England (BoE) Governor Andrew Baily, saying that rates could continue to rise, hurting the British economy. Even though it could propel the GBP/USD, it would hurt the economy. That can be seen by the GBP/USD’s fall after the BoE 50 bps rate hike.
Money market futures see a 65% chance or a 50-bps hike at the BoE’s next meeting. Regarding the Federal Reserve, the CME FedWatch Tool odds for a 25 bps hike in July are 86.8%, higher than the 81.8% yesterday.
The UK economic agenda will feature the Gross Domestic Product (GDP) for Q1 2023, the Current Account, and Business Investment. On the US front, the US Bureau of Economic Analysis (BEA) will feature the Fed’s preferred gauge for inflation, the core Personal Consumption Expenditure (PCE). The University of Michigan will also reveal the Consumer Sentiment, while the Chicago Fed will release its PMI.
The GBP/USD is set to extend its losses if it achieves a daily close below 1.2600; otherwise, GBP buyers could remain hopeful of a possible test of the 20-day Exponential Moving Average (EMA) at 1.2645. Nevertheless, if GBP/USD surpasses below 1.2600, the next support would be the 50-day EMA at 1.2544 before challenging the 1.2500 mark.
Technical Levels: Supports and Resistances
GBPUSD currently trading at 1.2618 at the time of writing. Pair opened at 1.2635 and is trading with a change of -0.13 % .
| Overview | Overview.1 | |
|---|---|---|
| 0 | Today last price | 1.2618 |
| 1 | Today Daily Change | -0.0017 |
| 2 | Today Daily Change % | -0.1300 |
| 3 | Today daily open | 1.2635 |
The pair is trading below its 20 Daily moving average @ 1.2635, above its 50 Daily moving average @ 1.254 , above its 100 Daily moving average @ 1.2368 and above its 200 Daily moving average @ 1.2096
| Trends | Trends.1 | |
|---|---|---|
| 0 | Daily SMA20 | 1.2635 |
| 1 | Daily SMA50 | 1.2540 |
| 2 | Daily SMA100 | 1.2368 |
| 3 | Daily SMA200 | 1.2096 |
The previous day high was 1.2753 while the previous day low was 1.2606. The daily 38.2% Fib levels comes at 1.2662, expected to provide resistance. Similarly, the daily 61.8% fib level is at 1.2697, expected to provide resistance.
Note the levels of interest below:
- Pivot support is noted at 1.2577, 1.2519, 1.2431
- Pivot resistance is noted at 1.2723, 1.2811, 1.2869
| Levels | Levels.1 |
|---|---|
| Previous Daily High | 1.2753 |
| Previous Daily Low | 1.2606 |
| Previous Weekly High | 1.2845 |
| Previous Weekly Low | 1.2685 |
| Previous Monthly High | 1.2680 |
| Previous Monthly Low | 1.2308 |
| Daily Fibonacci 38.2% | 1.2662 |
| Daily Fibonacci 61.8% | 1.2697 |
| Daily Pivot Point S1 | 1.2577 |
| Daily Pivot Point S2 | 1.2519 |
| Daily Pivot Point S3 | 1.2431 |
| Daily Pivot Point R1 | 1.2723 |
| Daily Pivot Point R2 | 1.2811 |
| Daily Pivot Point R3 | 1.2869 |
[/s2If]
Nehcap Expert Advisor
The NEHCAP MT4 EA is high quality professional trading system geared to generate returns without using GRID or martingales. Each trade has strict risk per trade parameter. The pairs under management include EURUSD, GBPUSD, AUDCAD, AUDNZD,GBPAUD, EURAUD, EURCAD, CHFJPY and many more.
The system is trading live: LIVE ACCOUNT TRACKING
You can run it free. Apply for a free trial and track our account. Buy the system or use profit share mechanism to generate returns on your MT4.
Join Our Telegram Group
")


