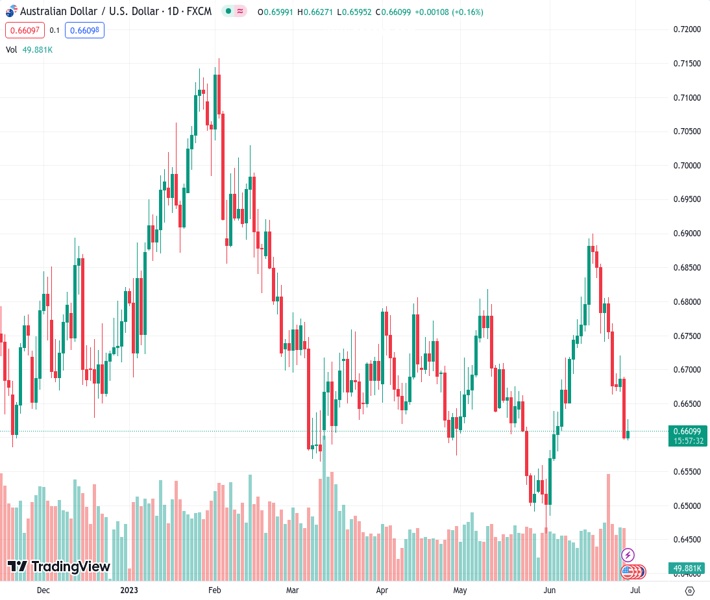
The AUDUSD currency pair, with a value of 0.66092, has pulled back from its high for the day and diminished the gains achieved from positive Australian data. It has reached a three-week low. According to the viewpoint of @nehcap, it is predicted that there will be more decline in the value.
…
This is a premium post.
[s2If !current_user_can(access_s2member_level4)]Please register for FREE REGISTER to read full post below containing analysis. In case of any error or you think you are not able to read the full post below, please email us at support#nehcap.com [lwa][/s2If] [s2If current_user_can(access_s2member_level1)]
- AUD/USD retreats from intraday high, fades Aussie data inspired gains at three-week low.
The pair currently trades last at 0.66092.
The previous day high was 0.669 while the previous day low was 0.6597. The daily 38.2% Fib levels comes at 0.6633, expected to provide resistance. Similarly, the daily 61.8% fib level is at 0.6654, expected to provide resistance.
AUD/USD pares the biggest daily loss since early March, despite retreating from an intraday high to around 0.6605 amid early Thursday morning in Europe. In doing so, the Aussie pair eases from the daily tops while reversing Australia Retail Sales data-linked gains but stays mildly bid by the press time.
It’s worth noting that a surprise jump in the Aussie Retail Sales, to 0.7% MoM for May, offered breathing space to the bears after the Australian Monthly Consumer Price Index (CPI) disappointed the Reserve Bank of Australia (RBA) hawks the previous day. However, fears of hawkish comments from Fed Chair Jerome Powell seem to weigh on the AUD/USD price.
Technically, the risk-barometer pair’s U-turn from the 200-SMA, around 0.6695 by the press time, joins bearish MACD signals to keep the AUD/USD pair sellers hopeful.
However, the below-50.0 levels of the RSI (14) suggest bottom-picking of the Aussie pair, which in turn highlights the 0.6550-45 support confluence comprising the 61.8% Fibonacci retracement of the October-February north run and eight-month-old rising support line.
In a case where the AUD/USD drops below 0.6545, the odds of witnessing a slump towards the yearly low marked in May around 0.6460 can’t be ruled out.
Alternatively, a downward-sloping trend line from June 16, around 0.6675 at the latest, restricts the immediate upside of the AUD/USD pair ahead of the 200-SMA level of around 0.6695.
That said, the 0.6700 round figure also acts as an additional upside filter before directing the price to the 38.2% Fibonacci retracement level and the monthly high, respectively near 0.6780 and 0.6900.
Trend: Further downside expected
Technical Levels: Supports and Resistances
AUDUSD currently trading at 0.6608 at the time of writing. Pair opened at 0.6601 and is trading with a change of 0.11% % .
| Overview | Overview.1 | |
|---|---|---|
| 0 | Today last price | 0.6608 |
| 1 | Today Daily Change | 0.0007 |
| 2 | Today Daily Change % | 0.11% |
| 3 | Today daily open | 0.6601 |
The pair remains strongly bearish on the daily time frame. It trades below the 20 SMA @ 0.6724, 50 SMA 0.6677, 100 SMA @ 0.6706 and 200 SMA @ 0.6692.
| Trends | Trends.1 | |
|---|---|---|
| 0 | Daily SMA20 | 0.6724 |
| 1 | Daily SMA50 | 0.6677 |
| 2 | Daily SMA100 | 0.6706 |
| 3 | Daily SMA200 | 0.6692 |
The previous day high was 0.669 while the previous day low was 0.6597. The daily 38.2% Fib levels comes at 0.6633, expected to provide resistance. Similarly, the daily 61.8% fib level is at 0.6654, expected to provide resistance.
Note the levels of interest below:
- Pivot support is noted at 0.6569, 0.6536, 0.6476
- Pivot resistance is noted at 0.6661, 0.6722, 0.6754
| Levels | Levels.1 |
|---|---|
| Previous Daily High | 0.6690 |
| Previous Daily Low | 0.6597 |
| Previous Weekly High | 0.6886 |
| Previous Weekly Low | 0.6663 |
| Previous Monthly High | 0.6818 |
| Previous Monthly Low | 0.6458 |
| Daily Fibonacci 38.2% | 0.6633 |
| Daily Fibonacci 61.8% | 0.6654 |
| Daily Pivot Point S1 | 0.6569 |
| Daily Pivot Point S2 | 0.6536 |
| Daily Pivot Point S3 | 0.6476 |
| Daily Pivot Point R1 | 0.6661 |
| Daily Pivot Point R2 | 0.6722 |
| Daily Pivot Point R3 | 0.6754 |
[/s2If]
Nehcap Expert Advisor
The NEHCAP MT4 EA is high quality professional trading system geared to generate returns without using GRID or martingales. Each trade has strict risk per trade parameter. The pairs under management include EURUSD, GBPUSD, AUDCAD, AUDNZD,GBPAUD, EURAUD, EURCAD, CHFJPY and many more.
The system is trading live: LIVE ACCOUNT TRACKING
You can run it free. Apply for a free trial and track our account. Buy the system or use profit share mechanism to generate returns on your MT4.
Join Our Telegram Group
")


