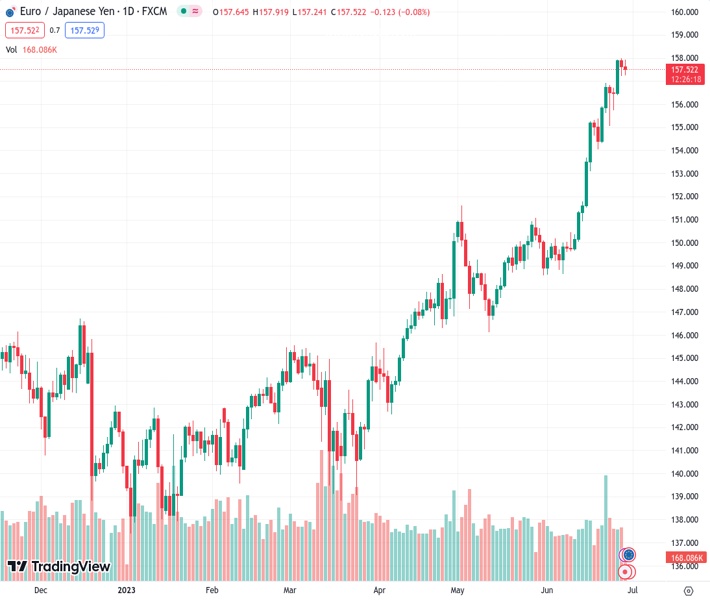
On Thursday, there was some interest in purchasing the EURJPY pair at 157.528, but this buying action did not continue.
…
This is a premium post.
[s2If !current_user_can(access_s2member_level4)]Please register for FREE REGISTER to read full post below containing analysis. In case of any error or you think you are not able to read the full post below, please email us at support#nehcap.com [lwa][/s2If] [s2If current_user_can(access_s2member_level1)]
- EUR/JPY attracts some dip-buying on Thursday, albeit lacks follow-through.
The pair currently trades last at 157.528.
The previous day high was 158.0 while the previous day low was 157.23. The daily 38.2% Fib levels comes at 157.52, expected to provide support. Similarly, the daily 61.8% fib level is at 157.71, expected to provide resistance.
The EUR/JPY cross reverses an intraday dip to the 157.25-157.20 area on Thursday and climbs back closer to its highest level since September 2008 touched the previous day. Spot prices, however, retreat a few pips during the early part of the European session and remain below the 158.00 mark, though the fundamental backdrop seems tilted firmly in favour of bullish traders.
Despite intervention fears, the Japanese Yen (JPY) continues with its relative underperformance in the wake of a more dovish stance adopted by the Bank of Japan (BoJ) and turns out to be a key factor lending support to the EUR/JPY cross. It is worth recalling that Japanese Finance Minister Shunichi Suzuki said earlier this week that they will watch the forex market with a sense of urgency and would respond appropriately if the currency moves became excessive. The warning was reiterated by Japan’s top currency diplomat Masato Kanda, though fails to attract any meaningful buying around the JPY as investors seem convinced that BoJ’s negative interest-rate policy will remain in place at least until next year.
Moreover, BoJ Governor Kazuo Ueda recently ruled out the possibility of any change in ultra-loose policy settings and signalled no immediate plans to alter the yield curve control measures. In contrast, the European Central Bank (ECB) President Christine Lagarde cemented market expectations for a ninth consecutive lift-off in July. Speaking at the Sintra central banking event in Portugal, Lagarde said that inflation in the Eurozone is too high and is set to remain so for too long. This, in turn, lifted bets for more rate hikes from the ECB this year, which, in turn, is seen acting as a tailwind for the shared currency and supports prospects for a further near-term appreciating move for the EUR/JPY cross.
That said, the Relative Strength Index (RSI) on the daily chart remains in the overbought territory and makes it prudent to wait for some near-term consolidation or a modest pullback before placing fresh bullish bets. Nevertheless, the aforementioned fundamental backdrop suggests that the path of least resistance for the EUR/JPY cross is to the upside. Hence, any meaningful corrective decline might still be seen as an opportunity for bulls and is more likely to remain limited.
Technical Levels: Supports and Resistances
EURJPY currently trading at 157.59 at the time of writing. Pair opened at 157.68 and is trading with a change of -0.06 % .
| Overview | Overview.1 | |
|---|---|---|
| 0 | Today last price | 157.59 |
| 1 | Today Daily Change | -0.09 |
| 2 | Today Daily Change % | -0.06 |
| 3 | Today daily open | 157.68 |
The pair remains strongly bullish on the daily timeframe. It trades above its 20 SMA @ 153.03, 50 SMA 150.48, 100 SMA @ 147.1 and 200 SMA @ 145.02.
| Trends | Trends.1 | |
|---|---|---|
| 0 | Daily SMA20 | 153.03 |
| 1 | Daily SMA50 | 150.48 |
| 2 | Daily SMA100 | 147.10 |
| 3 | Daily SMA200 | 145.02 |
The previous day high was 158.0 while the previous day low was 157.23. The daily 38.2% Fib levels comes at 157.52, expected to provide support. Similarly, the daily 61.8% fib level is at 157.71, expected to provide resistance.
Note the levels of interest below:
- Pivot support is noted at 157.27, 156.87, 156.5
- Pivot resistance is noted at 158.04, 158.4, 158.81
| Levels | Levels.1 |
|---|---|
| Previous Daily High | 158.00 |
| Previous Daily Low | 157.23 |
| Previous Weekly High | 156.93 |
| Previous Weekly Low | 154.05 |
| Previous Monthly High | 151.62 |
| Previous Monthly Low | 146.14 |
| Daily Fibonacci 38.2% | 157.52 |
| Daily Fibonacci 61.8% | 157.71 |
| Daily Pivot Point S1 | 157.27 |
| Daily Pivot Point S2 | 156.87 |
| Daily Pivot Point S3 | 156.50 |
| Daily Pivot Point R1 | 158.04 |
| Daily Pivot Point R2 | 158.40 |
| Daily Pivot Point R3 | 158.81 |
[/s2If]
Nehcap Expert Advisor
The NEHCAP MT4 EA is high quality professional trading system geared to generate returns without using GRID or martingales. Each trade has strict risk per trade parameter. The pairs under management include EURUSD, GBPUSD, AUDCAD, AUDNZD,GBPAUD, EURAUD, EURCAD, CHFJPY and many more.
The system is trading live: LIVE ACCOUNT TRACKING
You can run it free. Apply for a free trial and track our account. Buy the system or use profit share mechanism to generate returns on your MT4.
Join Our Telegram Group
")


