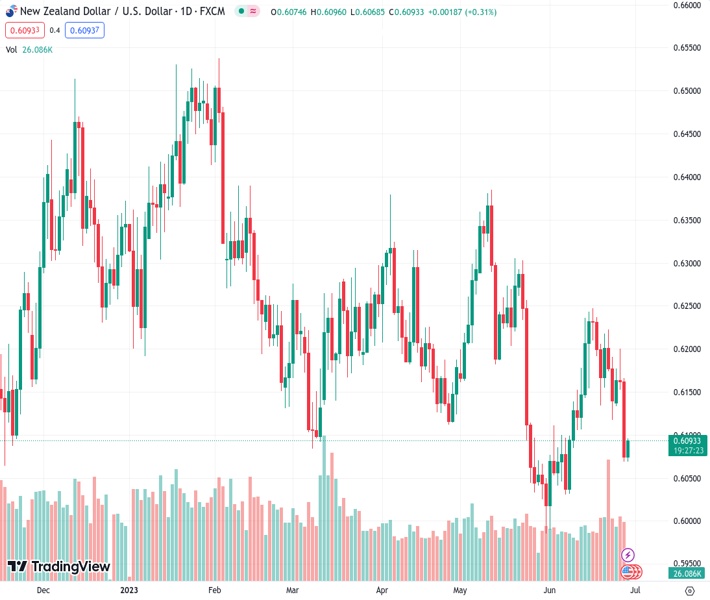
NZDUSD at 0.60916 experiences a small rebound from its lowest point in several weeks, but it appears that there is not much potential for further gains.
…
This is a premium post.
[s2If !current_user_can(access_s2member_level4)]Please register for FREE REGISTER to read full post below containing analysis. In case of any error or you think you are not able to read the full post below, please email us at support#nehcap.com [lwa][/s2If] [s2If current_user_can(access_s2member_level1)]
- NZD/USD stages a modest bounce from a multi-week low, though the upside seems limited.
The pair currently trades last at 0.60916.
The previous day high was 0.6173 while the previous day low was 0.6068. The daily 38.2% Fib levels comes at 0.6108, expected to provide resistance. Similarly, the daily 61.8% fib level is at 0.6133, expected to provide resistance.
The NZD/USD pair recovers a few pips from a nearly three-week low touched during the Asian session on Thursday and now trades just below the 0.6100 round-figure mark. The fundamental backdrop, however, remains tilted in favour of bearish traders and warrants some caution before positioning for any meaningful upside.
The New Zealand Dollar (NZD) has been one of the worst-performing G10 currencies in the past 24 hours in the wake of the diverging monetary policy outlooks between the Reserve Bank of New Zealand (RBNZ) and the Federal Reserve (Fed). It is worth mentioning that the RBNZ, after raising rates by 25 bps to 5.5% or the highest in more than 14 years in May, signalled that it was done with its most aggressive hiking cycle since 1999. The RBNZ also sees rates peaking at the current level, before rate cuts commence from the third quarter of next year.
In contrast, the Fed signalled earlier this month that borrowing costs may still need to rise as much as 50 bps by the end of this year. The outlook was reinforced by Fed Chair Jerome Powell on Wednesday, reiterating that two rate increases are likely this year. Speaking at a European Central Bank (ECB) conference, Powell did not rule out the possibility of a rate hike at the next FOMC policy meeting on July 25-26 and said that he does not see inflation coming down to the Fed’s 2% target until 2025. This, in turn, continues to underpin the US Dollar (USD).
Furthermore, reports that the US is considering new restrictions on exports of artificial intelligence chips to China fuel concerns about deteriorating relations between the world’s two largest economies. This might turn out to be another factor weighing on antipodean currencies, including the Kiwi, and keep a lid on the NZD/USD pair. Market participants now look to the US economic docket – featuring the final Q1 GDP print, the Weekly Initial Jobless Claims and Pending Home Sales – for a fresh impetus later during the North American session.
Technical Levels: Supports and Resistances
NZDUSD currently trading at 0.6083 at the time of writing. Pair opened at 0.6076 and is trading with a change of 0.12 % .
| Overview | Overview.1 | |
|---|---|---|
| 0 | Today last price | 0.6083 |
| 1 | Today Daily Change | 0.0007 |
| 2 | Today Daily Change % | 0.1200 |
| 3 | Today daily open | 0.6076 |
The pair remains strongly bearish on the daily time frame. It trades below the 20 SMA @ 0.6138, 50 SMA 0.6169, 100 SMA @ 0.6199 and 200 SMA @ 0.6159.
| Trends | Trends.1 | |
|---|---|---|
| 0 | Daily SMA20 | 0.6138 |
| 1 | Daily SMA50 | 0.6169 |
| 2 | Daily SMA100 | 0.6199 |
| 3 | Daily SMA200 | 0.6159 |
The previous day high was 0.6173 while the previous day low was 0.6068. The daily 38.2% Fib levels comes at 0.6108, expected to provide resistance. Similarly, the daily 61.8% fib level is at 0.6133, expected to provide resistance.
Note the levels of interest below:
- Pivot support is noted at 0.6038, 0.6001, 0.5933
- Pivot resistance is noted at 0.6143, 0.6211, 0.6248
| Levels | Levels.1 |
|---|---|
| Previous Daily High | 0.6173 |
| Previous Daily Low | 0.6068 |
| Previous Weekly High | 0.6237 |
| Previous Weekly Low | 0.6116 |
| Previous Monthly High | 0.6385 |
| Previous Monthly Low | 0.5985 |
| Daily Fibonacci 38.2% | 0.6108 |
| Daily Fibonacci 61.8% | 0.6133 |
| Daily Pivot Point S1 | 0.6038 |
| Daily Pivot Point S2 | 0.6001 |
| Daily Pivot Point S3 | 0.5933 |
| Daily Pivot Point R1 | 0.6143 |
| Daily Pivot Point R2 | 0.6211 |
| Daily Pivot Point R3 | 0.6248 |
[/s2If]
Nehcap Expert Advisor
The NEHCAP MT4 EA is high quality professional trading system geared to generate returns without using GRID or martingales. Each trade has strict risk per trade parameter. The pairs under management include EURUSD, GBPUSD, AUDCAD, AUDNZD,GBPAUD, EURAUD, EURCAD, CHFJPY and many more.
The system is trading live: LIVE ACCOUNT TRACKING
You can run it free. Apply for a free trial and track our account. Buy the system or use profit share mechanism to generate returns on your MT4.
Join Our Telegram Group
")


