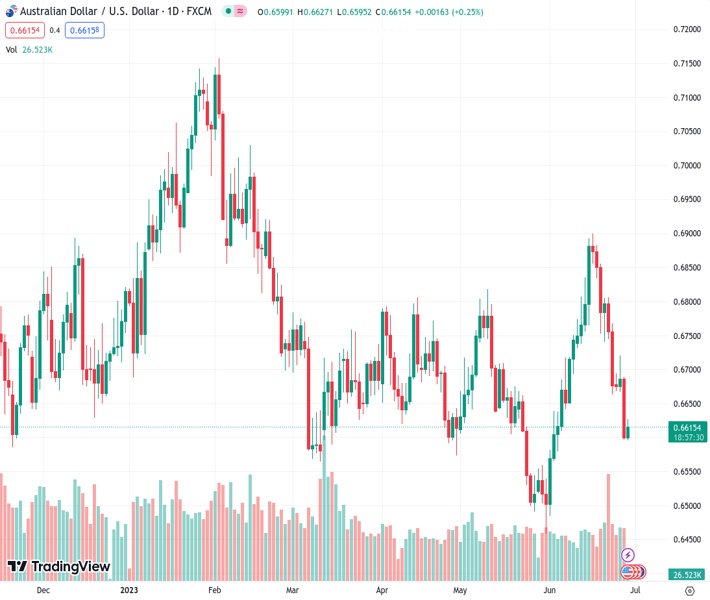
In spite of a quick recovery from a low point, AUDUSD at 0.66183, it appears that there is not much room for further improvement.
…
This is a premium post.
[s2If !current_user_can(access_s2member_level4)]Please register for FREE REGISTER to read full post below containing analysis. In case of any error or you think you are not able to read the full post below, please email us at support#nehcap.com [lwa][/s2If] [s2If current_user_can(access_s2member_level1)]
- AUD/USD rebounds swiftly from a multi-month low, albeit the upside potential seems limited.
The pair currently trades last at 0.66183.
The previous day high was 0.669 while the previous day low was 0.6597. The daily 38.2% Fib levels comes at 0.6633, expected to provide resistance. Similarly, the daily 61.8% fib level is at 0.6654, expected to provide resistance.
The AUD/USD pair stages a goodish recovery from sub-0.6600 levels, or a three-and-half-week low touched during the Asian session on Thursday and recovers a part of the previous day’s heavy losses. Spot prices currently trade around the 0.6620-0.6625 area, up nearly 0.35% for the day, and move little following the release of Australian Retail Sales data.
The Australian Bureau of Statistics reported that the total value of sales at the retail level rose by 0.7% in May as compared to a modest 0.1% increase anticipated and a flat reading in the previous month. The upbeat data, however, fails to provide any meaningful impetus to the Aussie as traders seem convinced that the Reserve Bank of Australia (RBA) will refrain from hiking interest rates in July. The expectations were lifted by domestic data released on Wednesday, which showed that consumer inflation slowed to a 13-month low in May. This, along with worries about deteriorating US-China relations, acts as a headwind for the AUD/USD pair, though subdued US Dollar (USD) price action could act as a tailwind, at least for the time being.
A generally positive tone around the equity markets is seen as a key factor undermining the safe-haven Greenback and lending some support to the risk-sensitive Australian Dollar (AUD). That said, any meaningful USD corrective decline from a two-week high touched on Wednesday seems elusive in the wake of a more hawkish stance adopted by the Federal Reserve (Fed). It is worth recalling that the US central bank earlier this month signalled that borrowing costs may still need to rise as much as 50 bps by the end of this year. Furthermore, Fed Chair Jerome Powell, speaking at the ECB conference on Wednesday, reiterated that two rate increases are likely this year and said that he does not see inflation coming down to the Fed’s 2% target until 2025.
The aforementioned fundamental backdrop suggests that the path of least resistance for the AUD/USD pair is to the downside and warrants some caution before positioning for any further intraday appreciating move. Hence, it will be prudent to wait for strong follow-through buying before confirming that spot prices have formed a near-term bottom and confirming that the recent rejection slide from the 0.6900 mark, or a multi-month peak, has run its course. Traders now look to the US economic docket, featuring the final Q1 GDP print, Initial Jobless Claims and Pending Home Sales, for some impetus later during the North American session.
Technical Levels: Supports and Resistances
AUDUSD currently trading at 0.6616 at the time of writing. Pair opened at 0.6601 and is trading with a change of 0.23 % .
| Overview | Overview.1 | |
|---|---|---|
| 0 | Today last price | 0.6616 |
| 1 | Today Daily Change | 0.0015 |
| 2 | Today Daily Change % | 0.2300 |
| 3 | Today daily open | 0.6601 |
The pair remains strongly bearish on the daily time frame. It trades below the 20 SMA @ 0.6724, 50 SMA 0.6677, 100 SMA @ 0.6706 and 200 SMA @ 0.6692.
| Trends | Trends.1 | |
|---|---|---|
| 0 | Daily SMA20 | 0.6724 |
| 1 | Daily SMA50 | 0.6677 |
| 2 | Daily SMA100 | 0.6706 |
| 3 | Daily SMA200 | 0.6692 |
The previous day high was 0.669 while the previous day low was 0.6597. The daily 38.2% Fib levels comes at 0.6633, expected to provide resistance. Similarly, the daily 61.8% fib level is at 0.6654, expected to provide resistance.
Note the levels of interest below:
- Pivot support is noted at 0.6569, 0.6536, 0.6476
- Pivot resistance is noted at 0.6661, 0.6722, 0.6754
| Levels | Levels.1 |
|---|---|
| Previous Daily High | 0.6690 |
| Previous Daily Low | 0.6597 |
| Previous Weekly High | 0.6886 |
| Previous Weekly Low | 0.6663 |
| Previous Monthly High | 0.6818 |
| Previous Monthly Low | 0.6458 |
| Daily Fibonacci 38.2% | 0.6633 |
| Daily Fibonacci 61.8% | 0.6654 |
| Daily Pivot Point S1 | 0.6569 |
| Daily Pivot Point S2 | 0.6536 |
| Daily Pivot Point S3 | 0.6476 |
| Daily Pivot Point R1 | 0.6661 |
| Daily Pivot Point R2 | 0.6722 |
| Daily Pivot Point R3 | 0.6754 |
[/s2If]
Nehcap Expert Advisor
The NEHCAP MT4 EA is high quality professional trading system geared to generate returns without using GRID or martingales. Each trade has strict risk per trade parameter. The pairs under management include EURUSD, GBPUSD, AUDCAD, AUDNZD,GBPAUD, EURAUD, EURCAD, CHFJPY and many more.
The system is trading live: LIVE ACCOUNT TRACKING
You can run it free. Apply for a free trial and track our account. Buy the system or use profit share mechanism to generate returns on your MT4.
Join Our Telegram Group
")


