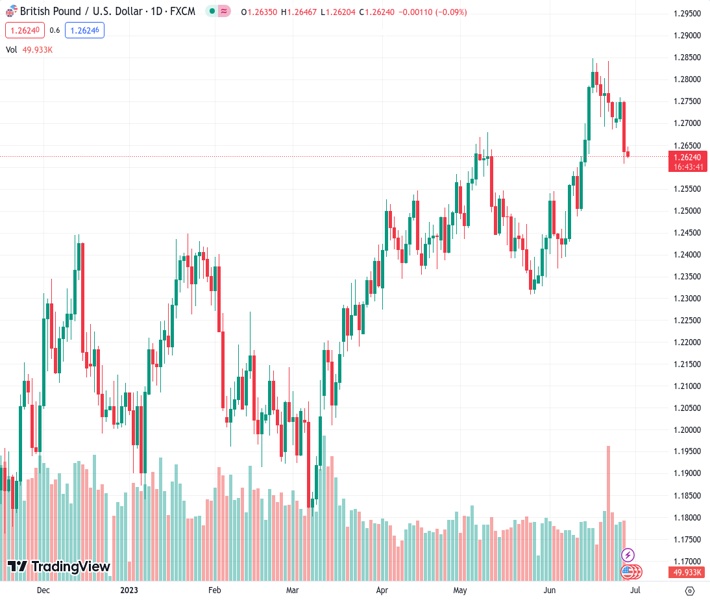
For the second day in a row, there is ongoing selling pressure on GBPUSD at a rate of 1.26259.
…
This is a premium post.
[s2If !current_user_can(access_s2member_level4)]Please register for FREE REGISTER to read full post below containing analysis. In case of any error or you think you are not able to read the full post below, please email us at support#nehcap.com [lwa][/s2If] [s2If current_user_can(access_s2member_level1)]
- GBP/USD remains under some selling pressure for the second successive day on Thursday.
The pair currently trades last at 1.26259.
The previous day high was 1.2753 while the previous day low was 1.2606. The daily 38.2% Fib levels comes at 1.2662, expected to provide resistance. Similarly, the daily 61.8% fib level is at 1.2697, expected to provide resistance.
The GBP/USD pair attracts fresh sellers near the 1.2645 region during the Asian session and turns lower for the second straight day on Thursday. The pair is currently placed around the 1.2620 area, down just over 0.10% for the day, and remains well within the striking distance of a two-week low touched on Wednesday.
The US Dollar (USD) stands tall near a two-week high and continues to draw support from Federal Reserve (Fed) Chair Jerome Powell’s overnight hawkish remarks, reiterating that two rate increases are likely this year. The British Pound (GBP), on the other hand, is weighed down by worries about economic headwinds stemming from a far more aggressive policy tightening by the Bank of England (BoE). This, in turn, is seen exerting some downward pressure on the GBP/USD pair and favours bearish traders.
From a technical perspective, spot prices now seem to have found acceptance below the 38.2% Fibonacci retracement level of the May-June rally. This validates the near-term negative outlook and supports prospects for an extension of the GBP/USD pair’s recent sharp retracement slide from a 14-month peak, around the 1.2848-1.2850 region set on June 16. That said, oscillators on the daily chart – though have been losing traction – are yet to confirm the bearish bias and warrant some caution for aggressive traders.
Hence, it will be prudent to wait for some follow-through selling below the 1.2600 mark, or the overnight swing low, before positioning for any further losses. The GBP/USD pair might then slide to the 50% Fibo. level, around the 1.2580 region, en route to the 50-day Simple Moving Average (SMA), currently pegged near the 1.2540 zone. This is followed by 61.8% Fibo. level, around the 1.2515 region and the 1.2500 psychological mark, which if broken decisively should pave the way for a further depreciating move.
On the flip side, any positive move above the 1.2640-1.2645 area, coinciding with the 38.2% Fibo. level, is likely to confront stiff resistance near a horizontal support breakpoint, just ahead of the 1.2700 mark. This is closely followed by 23.6% Fibo. level, around the 1.2715-1.2720 region. A sustained strength beyond the latter will negate the negative bias and lift the GBP/USD pair beyond the 1.2760-1.2765 intermediate hurdle, towards the 1.2800 mark en route to the YTD peak, near the 1.2840-1.2850 region.
Technical Levels: Supports and Resistances
GBPUSD currently trading at 1.2626 at the time of writing. Pair opened at 1.2635 and is trading with a change of -0.07 % .
| Overview | Overview.1 | |
|---|---|---|
| 0 | Today last price | 1.2626 |
| 1 | Today Daily Change | -0.0009 |
| 2 | Today Daily Change % | -0.0700 |
| 3 | Today daily open | 1.2635 |
The pair is trading below its 20 Daily moving average @ 1.2635, above its 50 Daily moving average @ 1.254 , above its 100 Daily moving average @ 1.2368 and above its 200 Daily moving average @ 1.2096
| Trends | Trends.1 | |
|---|---|---|
| 0 | Daily SMA20 | 1.2635 |
| 1 | Daily SMA50 | 1.2540 |
| 2 | Daily SMA100 | 1.2368 |
| 3 | Daily SMA200 | 1.2096 |
The previous day high was 1.2753 while the previous day low was 1.2606. The daily 38.2% Fib levels comes at 1.2662, expected to provide resistance. Similarly, the daily 61.8% fib level is at 1.2697, expected to provide resistance.
Note the levels of interest below:
- Pivot support is noted at 1.2577, 1.2519, 1.2431
- Pivot resistance is noted at 1.2723, 1.2811, 1.2869
| Levels | Levels.1 |
|---|---|
| Previous Daily High | 1.2753 |
| Previous Daily Low | 1.2606 |
| Previous Weekly High | 1.2845 |
| Previous Weekly Low | 1.2685 |
| Previous Monthly High | 1.2680 |
| Previous Monthly Low | 1.2308 |
| Daily Fibonacci 38.2% | 1.2662 |
| Daily Fibonacci 61.8% | 1.2697 |
| Daily Pivot Point S1 | 1.2577 |
| Daily Pivot Point S2 | 1.2519 |
| Daily Pivot Point S3 | 1.2431 |
| Daily Pivot Point R1 | 1.2723 |
| Daily Pivot Point R2 | 1.2811 |
| Daily Pivot Point R3 | 1.2869 |
[/s2If]
Nehcap Expert Advisor
The NEHCAP MT4 EA is high quality professional trading system geared to generate returns without using GRID or martingales. Each trade has strict risk per trade parameter. The pairs under management include EURUSD, GBPUSD, AUDCAD, AUDNZD,GBPAUD, EURAUD, EURCAD, CHFJPY and many more.
The system is trading live: LIVE ACCOUNT TRACKING
You can run it free. Apply for a free trial and track our account. Buy the system or use profit share mechanism to generate returns on your MT4.
Join Our Telegram Group
")


