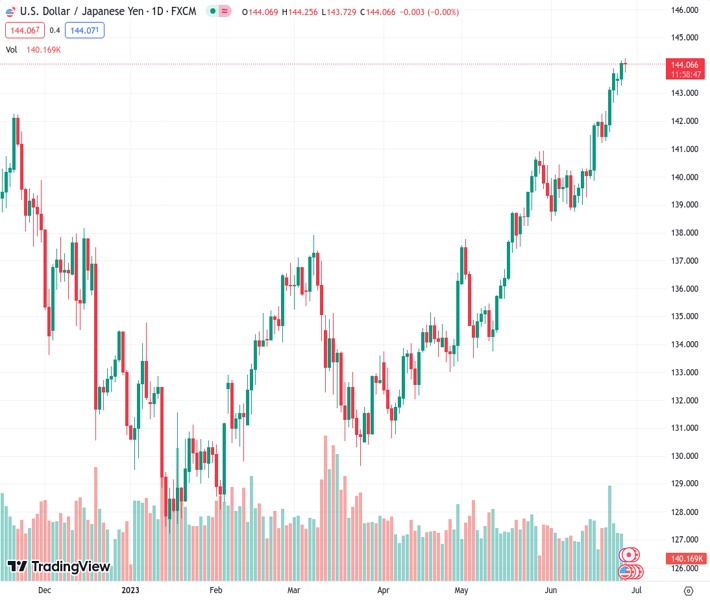
The USDJPY currency pair, trading at 144.097, bounces back from a small decrease during the day and rises to a new highest level of the year on Wednesday.
…
This is a premium post.
[s2If !current_user_can(access_s2member_level4)]Please register for FREE REGISTER to read full post below containing analysis. In case of any error or you think you are not able to read the full post below, please email us at support#nehcap.com [lwa][/s2If] [s2If current_user_can(access_s2member_level1)]
- USD/JPY reverses modest intraday slide and climbs to a fresh YTD peak on Wednesday.
The pair currently trades last at 144.097.
The previous day high was 144.18 while the previous day low was 143.28. The daily 38.2% Fib levels comes at 143.83, expected to provide support. Similarly, the daily 61.8% fib level is at 143.62, expected to provide support.
The USD/JPY pair attracts some dip-buying near the 143.75-143.70 area on Tuesday and touches a fresh high since November 2022 during the early European session. Spot prices currently trade around the 144.20-144.25 region, up 0.10% for the day, and seems poised to prolong its recent upward trajectory witnessed over the past three weeks or so.
Despite warnings by Japanese authorities to intervene again to stem losses for the domestic currencies, expectations that the Bank of Japan (BoJ) will sticks to its dovish stance undermine the Japanese Yen (JPY) and lend support to the USD/JPY pair. It is worth recalling that the BoJ Governor Kazuo Ueda recently ruled out the possibility of any imminent change in ultra-loose monetary policy settings and signalled no immediate plans to alter its yield curve control measures.
The marks a big divergence in comparison to a more hawkish stance adopted by other major central banks, including the Federal Reserve (Fed), which indicated that borrowing costs may still need to rise as much as 50 bps by the end of this year. The bets were reaffirmed by stronger-than-expected US macro data released on Tuesday. This, in turn, assists the US Dollar (USD) to gain some positive traction and turns out to be another factor acting as a tailwind for the USD/JPY pair.
Apart from this, the prevalent risk-on mood – as depicted by a further rise in the equity markets – undermines the safe-haven JPY
and supports prospects for a further near-term aprpecaiting move. Traders, however, prefer to wait on the sidelines ahead of Fed Chair Jerome Powell and BoJ Governor Kazuo Ueda’s appearance at the ECB Forum on Central Banking in Sintra. Nevertheless, the aforementioned fundamental backdrop seems tilted firmly in favour of bullish traders.
Hence, any meaningful corrective decline might still be seen as a buying opportunity and is more likely to remain short-lived. Even from a technical perspective, the USD/JPY pair has been trending higher along an upward sloping channel over the past three week or so. This further points to a well-established short-term bullish trend and adds credence to the positive outlook ahead of the release of the US Core PCE Price Index – the Fed’s preferred inflation gauge on Friday.
Technical Levels: Supports and Resistances
USDJPY currently trading at 144.11 at the time of writing. Pair opened at 144.08 and is trading with a change of 0.02 % .
| Overview | Overview.1 | |
|---|---|---|
| 0 | Today last price | 144.11 |
| 1 | Today Daily Change | 0.03 |
| 2 | Today Daily Change % | 0.02 |
| 3 | Today daily open | 144.08 |
The pair remains strongly bullish on the daily timeframe. It trades above its 20 SMA @ 140.88, 50 SMA 138.19, 100 SMA @ 135.88 and 200 SMA @ 137.22.
| Trends | Trends.1 | |
|---|---|---|
| 0 | Daily SMA20 | 140.88 |
| 1 | Daily SMA50 | 138.19 |
| 2 | Daily SMA100 | 135.88 |
| 3 | Daily SMA200 | 137.22 |
The previous day high was 144.18 while the previous day low was 143.28. The daily 38.2% Fib levels comes at 143.83, expected to provide support. Similarly, the daily 61.8% fib level is at 143.62, expected to provide support.
Note the levels of interest below:
- Pivot support is noted at 143.51, 142.95, 142.62
- Pivot resistance is noted at 144.41, 144.74, 145.3
| Levels | Levels.1 |
|---|---|
| Previous Daily High | 144.18 |
| Previous Daily Low | 143.28 |
| Previous Weekly High | 143.87 |
| Previous Weekly Low | 141.21 |
| Previous Monthly High | 140.93 |
| Previous Monthly Low | 133.50 |
| Daily Fibonacci 38.2% | 143.83 |
| Daily Fibonacci 61.8% | 143.62 |
| Daily Pivot Point S1 | 143.51 |
| Daily Pivot Point S2 | 142.95 |
| Daily Pivot Point S3 | 142.62 |
| Daily Pivot Point R1 | 144.41 |
| Daily Pivot Point R2 | 144.74 |
| Daily Pivot Point R3 | 145.30 |
[/s2If]
Nehcap Expert Advisor
The NEHCAP MT4 EA is high quality professional trading system geared to generate returns without using GRID or martingales. Each trade has strict risk per trade parameter. The pairs under management include EURUSD, GBPUSD, AUDCAD, AUDNZD,GBPAUD, EURAUD, EURCAD, CHFJPY and many more.
The system is trading live: LIVE ACCOUNT TRACKING
You can run it free. Apply for a free trial and track our account. Buy the system or use profit share mechanism to generate returns on your MT4.
Join Our Telegram Group
")


