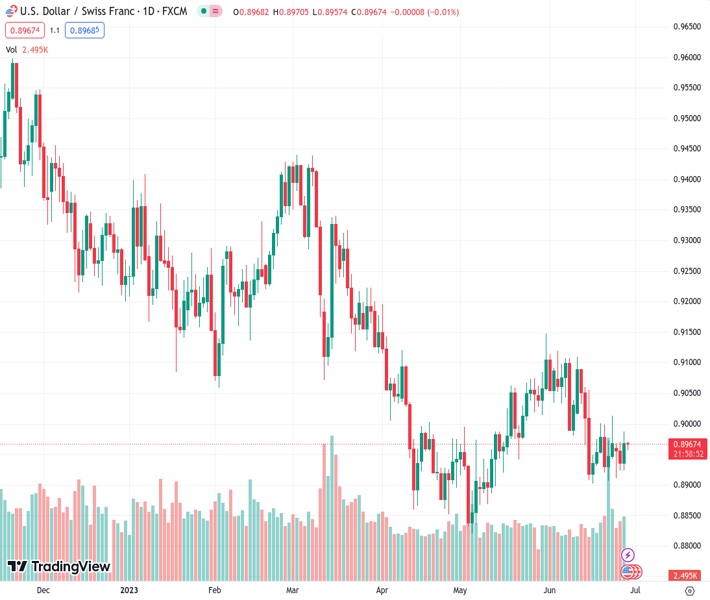
The USDCHF pair, currently trading at 0.89660, has recovered and is experiencing a small decrease of 0.02% after hitting its lowest level in two days. This rebound is attributed to speculation that the Federal Reserve may tighten its policies.
…
This is a premium post.
[s2If !current_user_can(access_s2member_level4)]Please register for FREE REGISTER to read full post below containing analysis. In case of any error or you think you are not able to read the full post below, please email us at support#nehcap.com [lwa][/s2If] [s2If current_user_can(access_s2member_level1)]
- USD/CHF rebounds and trades with minor losses of 0.02%, rallying from two-day lows amid Federal Reserve tightening speculations.
The pair currently trades last at 0.89660.
The previous day high was 0.897 while the previous day low was 0.8924. The daily 38.2% Fib levels comes at 0.8942, expected to provide support. Similarly, the daily 61.8% fib level is at 0.8953, expected to provide support.
As the Asian session began, the USD/CHF traded with minuscule losses of 0.02%; following Wednesday’s session, the USD/CHF pair rallied from two-day lows of 0.8922 and rose toward a daily high of 0.8687. Speculations of further tightening by the Federal Reserve (Fed) spurred a leg-up in the USD/CHF. At the time of writing, the USD/CHF exchanges hands at 0.8966.
From a medium-term perspective, the USD/CHF is neutral biased but testing a downslope resistance trendline at around the 0.8970/90 area. Oscillators like the Relative Strength Index (RSI), although in bearish territory, is about to turn bullish as it closes to the 50-midline. Meanwhile, the three-day Rate of Change (RoC) suggests buyers are gathering momentum, despite lacking the strength to pierce the 0.9000 mark.
If USD/CHF reclaims the 0.9000 figure, immediate resistance will emerge from the 50-day Exponential Moving Average (EMA) at 0.9008. above that price level lies a downslope resistance trendline drawn in late May, which passes around 0.9030/40 before the USD/CHF can rally toward the 100-day EMA at 0.9082.
Conversely, the USD/CHF first support would be the June 28 daily low at 0.8922, followed by the 0.8900 figure, ahead of challenging the year-to-date (YTD) low of 0.8819.
Technical Levels: Supports and Resistances
USDCHF currently trading at 0.8967 at the time of writing. Pair opened at 0.8936 and is trading with a change of 0.35 % .
| Overview | Overview.1 | |
|---|---|---|
| 0 | Today last price | 0.8967 |
| 1 | Today Daily Change | 0.0031 |
| 2 | Today Daily Change % | 0.3500 |
| 3 | Today daily open | 0.8936 |
The pair remains strongly bearish on the daily time frame. It trades below the 20 SMA @ 0.9011, 50 SMA 0.8979, 100 SMA @ 0.9092 and 200 SMA @ 0.9316.
| Trends | Trends.1 | |
|---|---|---|
| 0 | Daily SMA20 | 0.9011 |
| 1 | Daily SMA50 | 0.8979 |
| 2 | Daily SMA100 | 0.9092 |
| 3 | Daily SMA200 | 0.9316 |
The previous day high was 0.897 while the previous day low was 0.8924. The daily 38.2% Fib levels comes at 0.8942, expected to provide support. Similarly, the daily 61.8% fib level is at 0.8953, expected to provide support.
Note the levels of interest below:
- Pivot support is noted at 0.8917, 0.8897, 0.887
- Pivot resistance is noted at 0.8963, 0.899, 0.901
| Levels | Levels.1 |
|---|---|
| Previous Daily High | 0.8970 |
| Previous Daily Low | 0.8924 |
| Previous Weekly High | 0.9013 |
| Previous Weekly Low | 0.8907 |
| Previous Monthly High | 0.9148 |
| Previous Monthly Low | 0.8820 |
| Daily Fibonacci 38.2% | 0.8942 |
| Daily Fibonacci 61.8% | 0.8953 |
| Daily Pivot Point S1 | 0.8917 |
| Daily Pivot Point S2 | 0.8897 |
| Daily Pivot Point S3 | 0.8870 |
| Daily Pivot Point R1 | 0.8963 |
| Daily Pivot Point R2 | 0.8990 |
| Daily Pivot Point R3 | 0.9010 |
[/s2If]
Nehcap Expert Advisor
The NEHCAP MT4 EA is high quality professional trading system geared to generate returns without using GRID or martingales. Each trade has strict risk per trade parameter. The pairs under management include EURUSD, GBPUSD, AUDCAD, AUDNZD,GBPAUD, EURAUD, EURCAD, CHFJPY and many more.
The system is trading live: LIVE ACCOUNT TRACKING
You can run it free. Apply for a free trial and track our account. Buy the system or use profit share mechanism to generate returns on your MT4.
Join Our Telegram Group
")


