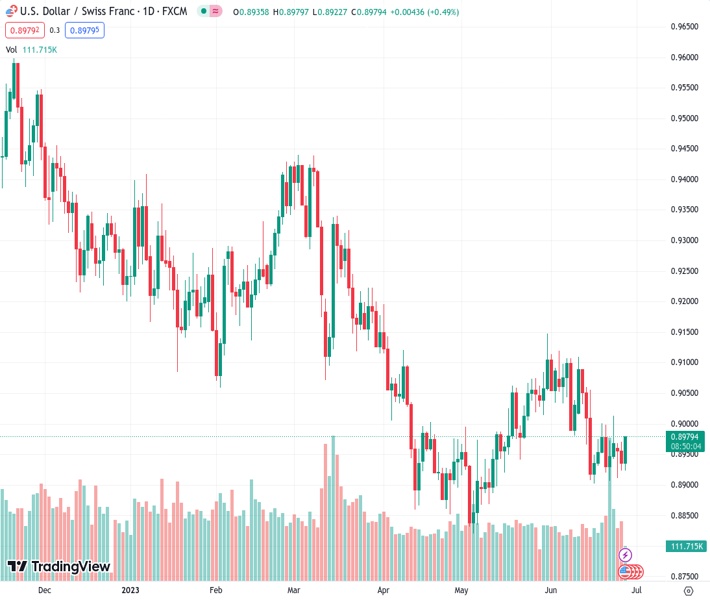
The USD/CHF currency pair, currently at 0.89790, has experienced a rebound and is approaching the 0.8960 mark. This comes in anticipation of Federal Reserve Chairman Powell restating a more aggressive monetary policy approach.
…
This is a premium post.
[s2If !current_user_can(access_s2member_level4)]Please register for FREE REGISTER to read full post below containing analysis. In case of any error or you think you are not able to read the full post below, please email us at support#nehcap.com [lwa][/s2If] [s2If current_user_can(access_s2member_level1)]
- USD/CHF has shown a recovery move to near 0.8960 as Fed Powell is expected to reiterate the hawkish stance.
The pair currently trades last at 0.89790.
The previous day high was 0.897 while the previous day low was 0.8924. The daily 38.2% Fib levels comes at 0.8942, expected to provide support. Similarly, the daily 61.8% fib level is at 0.8953, expected to provide support.
The USD/CHF pair has refreshed its day’s high at 0.8964 as the US Dollar Index (DXY) has got back in action ahead of the speech from Federal Reserve (Fed) chair Jerome Powell, which is scheduled at 13:30 GMT.
S&P500 futures have recovered the majority of the gains, portraying a recovery in the risk appetite of the market participants. Investors are digesting expectations from hawkish commentary from Fed Powell as the central bank has already conveyed that two small interest rate hikes are appropriate by year-end. Jerome Powell is widely expected to reiterate its hawkish stance at the European Central Bank (ECB) forum of Central Banking.
The US Dollar Index (DXY) is making efforts for coming out of the woods, which could be done by climbing above the immediate resistance of 102.70.
USD/CHF is jumped to near the horizontal resistance of the Ascending Triangle chart pattern plotted from June 26 high at 0.8969 on an hourly scale. The aforementioned pattern indicates a sheer contraction in volatility. Upward-sloping trendline of the chart pattern is placed from June 26 low at 0.8912.
The Swiss Franc asset has comfortably shifted above the 50-period Exponential Moving Average (EMA) at 0.8948, which indicates that the short-term trend is bullish.
The Relative Strength Index (RSI) (14) is testing territory above 60.00. Confident stability above the same would activate the bullish momentum.
Going forward, an upside move above the psychological resistance of 0.9000 would fade the bearish bias and will drive the asset toward June 06 low at 0.9033 and May 30 high at 0.9084.
In an alternate scenario, a breakdown below May 12 low around 0.8900 would expose the Swiss Franc asset to April 13 low at 0.8860 followed by the ultimate support plotted from May 04 low at 0.8820.
Technical Levels: Supports and Resistances
USDCHF currently trading at 0.8966 at the time of writing. Pair opened at 0.8936 and is trading with a change of 0.34 % .
| Overview | Overview.1 | |
|---|---|---|
| 0 | Today last price | 0.8966 |
| 1 | Today Daily Change | 0.0030 |
| 2 | Today Daily Change % | 0.3400 |
| 3 | Today daily open | 0.8936 |
The pair remains strongly bearish on the daily time frame. It trades below the 20 SMA @ 0.9011, 50 SMA 0.8979, 100 SMA @ 0.9092 and 200 SMA @ 0.9316.
| Trends | Trends.1 | |
|---|---|---|
| 0 | Daily SMA20 | 0.9011 |
| 1 | Daily SMA50 | 0.8979 |
| 2 | Daily SMA100 | 0.9092 |
| 3 | Daily SMA200 | 0.9316 |
The previous day high was 0.897 while the previous day low was 0.8924. The daily 38.2% Fib levels comes at 0.8942, expected to provide support. Similarly, the daily 61.8% fib level is at 0.8953, expected to provide support.
Note the levels of interest below:
- Pivot support is noted at 0.8917, 0.8897, 0.887
- Pivot resistance is noted at 0.8963, 0.899, 0.901
| Levels | Levels.1 |
|---|---|
| Previous Daily High | 0.8970 |
| Previous Daily Low | 0.8924 |
| Previous Weekly High | 0.9013 |
| Previous Weekly Low | 0.8907 |
| Previous Monthly High | 0.9148 |
| Previous Monthly Low | 0.8820 |
| Daily Fibonacci 38.2% | 0.8942 |
| Daily Fibonacci 61.8% | 0.8953 |
| Daily Pivot Point S1 | 0.8917 |
| Daily Pivot Point S2 | 0.8897 |
| Daily Pivot Point S3 | 0.8870 |
| Daily Pivot Point R1 | 0.8963 |
| Daily Pivot Point R2 | 0.8990 |
| Daily Pivot Point R3 | 0.9010 |
[/s2If]
Nehcap Expert Advisor
The NEHCAP MT4 EA is high quality professional trading system geared to generate returns without using GRID or martingales. Each trade has strict risk per trade parameter. The pairs under management include EURUSD, GBPUSD, AUDCAD, AUDNZD,GBPAUD, EURAUD, EURCAD, CHFJPY and many more.
The system is trading live: LIVE ACCOUNT TRACKING
You can run it free. Apply for a free trial and track our account. Buy the system or use profit share mechanism to generate returns on your MT4.
Join Our Telegram Group
")


