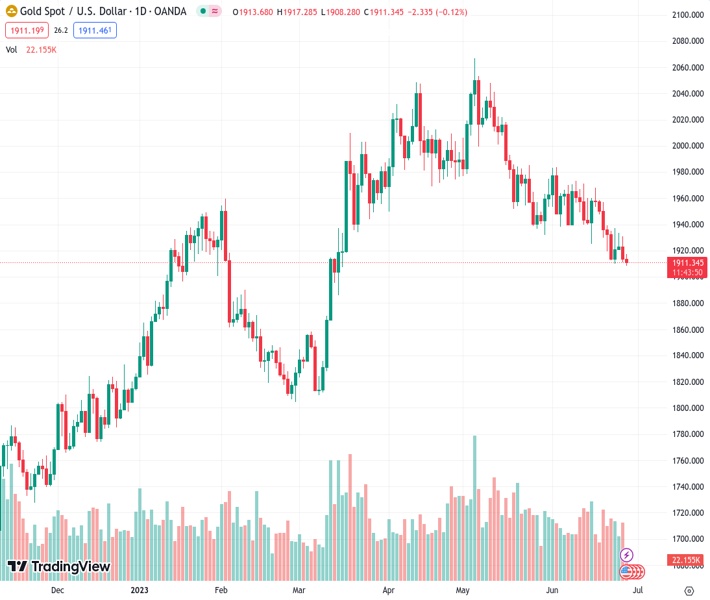
The price of gold, symbolized as XAUUSD, is gradually decreasing and approaching the support level of $1,900.00, in anticipation of Federal Reserve Chairman Jerome Powell’s upcoming speech.
…
This is a premium post.
[s2If !current_user_can(access_s2member_level4)]Please register for FREE REGISTER to read full post below containing analysis. In case of any error or you think you are not able to read the full post below, please email us at support#nehcap.com [lwa][/s2If] [s2If current_user_can(access_s2member_level1)]
- Gold price is declining towards the $1,900.00 support ahead of Fed Powell’s speech.
The pair currently trades last at 1911.05.
The previous day high was 1930.75 while the previous day low was 1910.93. The daily 38.2% Fib levels comes at 1918.5, expected to provide resistance. Similarly, the daily 61.8% fib level is at 1923.18, expected to provide resistance.
Gold price (XAU/USD) has challenged the crucial support of $1,910.00 in the London session. The precious metal is declining towards the psychological support of $1,900.00 as investors are expecting hawkish interest rate guidance from Federal Reserve (Fed) chair Jerome Powell.
S&P500 futures have posted decent losses overnight as investors are cautious that hawkish remarks from Jerome Powell would propel fears of a recession in the United States economy. According to HSBC Asset Management the US will enter a downturn in the fourth quarter, followed by a “year of contraction and a European recession in 2024.
The US Dollar Index (DXY) is struggling to sustain above the critical resistance of 102.60 despite the market mood has turned cautious. It is highly likely that Fed Powell would stick to the guidance delivered earlier that the central bank will hike interest rates at a ‘careful pace’. San Francisco Fed Bank President Mary Daly suggested that two more rate hikes this year is a “very reasonable” projection.
Meanwhile, the US Durable Goods Orders data (May) also remained resilient despite tight monetary policy by the Fed. The economic data expanded by 1.7% while the street was anticipating a contraction of 1%. May’s Durables data has outperformed April’s figure of 1.2%.
Gold price has tumbled to near the 61.8% Fibonacci retracement (plotted from February 28 low at $1,804.76 to May 03 high at $2,079.76) at $1,909.00 on a four-hour scale. Downward-sloping 200-period Exponential Moving Average (EMA) at $1,952.74 indicates that more downside is in the pipeline.
The Relative Strength Index (RSI) (14) is oscillating in the bearish range of 20.00-60.00, which indicates that the downside momentum is active.
Technical Levels: Supports and Resistances
XAUUSD currently trading at 1910.01 at the time of writing. Pair opened at 1913.74 and is trading with a change of -0.19 % .
| Overview | Overview.1 | |
|---|---|---|
| 0 | Today last price | 1910.01 |
| 1 | Today Daily Change | -3.73 |
| 2 | Today Daily Change % | -0.19 |
| 3 | Today daily open | 1913.74 |
The pair is trading below its 20 Daily moving average @ 1946.56, below its 50 Daily moving average @ 1974.04 , below its 100 Daily moving average @ 1943.21 and above its 200 Daily moving average @ 1855.8
| Trends | Trends.1 | |
|---|---|---|
| 0 | Daily SMA20 | 1946.56 |
| 1 | Daily SMA50 | 1974.04 |
| 2 | Daily SMA100 | 1943.21 |
| 3 | Daily SMA200 | 1855.80 |
The previous day high was 1930.75 while the previous day low was 1910.93. The daily 38.2% Fib levels comes at 1918.5, expected to provide resistance. Similarly, the daily 61.8% fib level is at 1923.18, expected to provide resistance.
Note the levels of interest below:
- Pivot support is noted at 1906.2, 1898.65, 1886.38
- Pivot resistance is noted at 1926.02, 1938.29, 1945.84
| Levels | Levels.1 |
|---|---|
| Previous Daily High | 1930.75 |
| Previous Daily Low | 1910.93 |
| Previous Weekly High | 1958.85 |
| Previous Weekly Low | 1910.18 |
| Previous Monthly High | 2079.76 |
| Previous Monthly Low | 1932.12 |
| Daily Fibonacci 38.2% | 1918.50 |
| Daily Fibonacci 61.8% | 1923.18 |
| Daily Pivot Point S1 | 1906.20 |
| Daily Pivot Point S2 | 1898.65 |
| Daily Pivot Point S3 | 1886.38 |
| Daily Pivot Point R1 | 1926.02 |
| Daily Pivot Point R2 | 1938.29 |
| Daily Pivot Point R3 | 1945.84 |
[/s2If]
Nehcap Expert Advisor
The NEHCAP MT4 EA is high quality professional trading system geared to generate returns without using GRID or martingales. Each trade has strict risk per trade parameter. The pairs under management include EURUSD, GBPUSD, AUDCAD, AUDNZD,GBPAUD, EURAUD, EURCAD, CHFJPY and many more.
The system is trading live: LIVE ACCOUNT TRACKING
You can run it free. Apply for a free trial and track our account. Buy the system or use profit share mechanism to generate returns on your MT4.
Join Our Telegram Group
")


