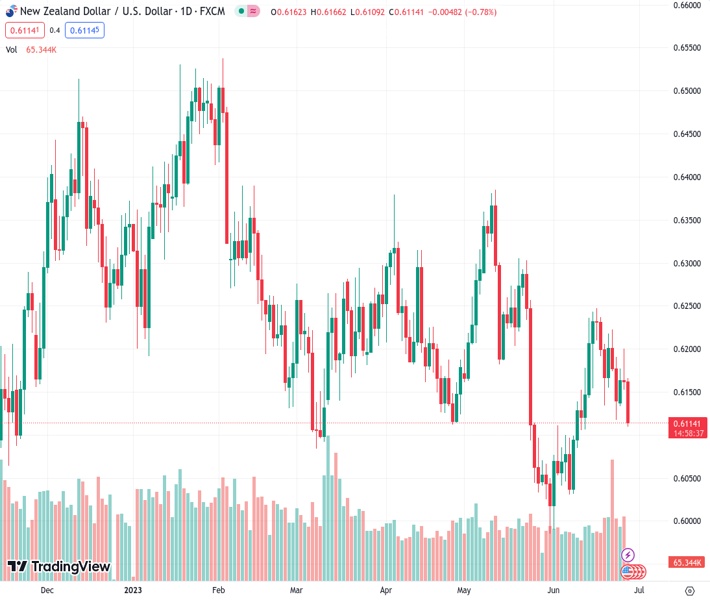
The New Zealand Dollar to US Dollar exchange rate, currently at 0.61120, has reached a new low for the past two weeks at 0.6113 due to a negative forecast for the Chinese economy.
…
This is a premium post.
[s2If !current_user_can(access_s2member_level4)]Please register for FREE REGISTER to read full post below containing analysis. In case of any error or you think you are not able to read the full post below, please email us at support#nehcap.com [lwa][/s2If] [s2If current_user_can(access_s2member_level1)]
- NZD/USD has refreshed its two-week low at 0.6113 amid a bleak outlook for China.
The pair currently trades last at 0.61120.
The previous day high was 0.6202 while the previous day low was 0.6143. The daily 38.2% Fib levels comes at 0.6165, expected to provide resistance. Similarly, the daily 61.8% fib level is at 0.6179, expected to provide resistance.
The NZD/USD pair has printed a fresh two-week low at 0.6113 in the early European session. More downside in the Kiwi asset is anticipated as Chinese economic prospects are worsening further due to bleak demand and weak exports.
China’s National Bureau of Statistics (NBS) reported that corporate profits contracted 12.6% in May above an 18.2% drop in April due to weak households demand. It is worth noting that New Zealand is one of the leading trading partners of China and the weak economic outlook of China would be weighing pressure on the New Zealand Dollar.
S&P500 futures are showing caution despite a bullish settlement on Tuesday. Investors have turned risk-averse ahead of the speech from Federal Reserve (Fed) chair Jerome Powell to assess the interest rate guidance.
The US Dollar Index (DXY) is struggling to keep stability above the immediate resistance of 102.60.
NZD/USD is consistently forming lower highs on a two-hour scale, which indicates that investors are capitalizing on each pullback as a selling opportunity. The Kiwi asset has been failing to auction above the 200-period Exponential Moving Average (EMA) at 0.6160, which portrays that the long-term trend is bearish.
Action in the Relative Strength Index (RSI) (14) indicates that 60.00 is a barricade and territory below 40.00 is consistently tested. This conveys that the bullish momentum is active.
Further downside below the intraday low at 0.6113 will expose the asset to June 05 low at 0.6041. A slippage below the latter would expose the asset to psychological support at 0.6000.
Alternatively, a confident break above May 17 high at 0.6261 will drive the Kiwi asset toward May 19 high at 0.6306 followed by May 08 high around 0.6360.
Technical Levels: Supports and Resistances
NZDUSD currently trading at 0.6119 at the time of writing. Pair opened at 0.6163 and is trading with a change of -0.71 % .
| Overview | Overview.1 | |
|---|---|---|
| 0 | Today last price | 0.6119 |
| 1 | Today Daily Change | -0.0044 |
| 2 | Today Daily Change % | -0.7100 |
| 3 | Today daily open | 0.6163 |
The pair remains strongly bearish on the daily time frame. It trades below the 20 SMA @ 0.6135, 50 SMA 0.6172, 100 SMA @ 0.6202 and 200 SMA @ 0.6158.
| Trends | Trends.1 | |
|---|---|---|
| 0 | Daily SMA20 | 0.6135 |
| 1 | Daily SMA50 | 0.6172 |
| 2 | Daily SMA100 | 0.6202 |
| 3 | Daily SMA200 | 0.6158 |
The previous day high was 0.6202 while the previous day low was 0.6143. The daily 38.2% Fib levels comes at 0.6165, expected to provide resistance. Similarly, the daily 61.8% fib level is at 0.6179, expected to provide resistance.
Note the levels of interest below:
- Pivot support is noted at 0.6137, 0.6111, 0.6078
- Pivot resistance is noted at 0.6195, 0.6228, 0.6254
| Levels | Levels.1 |
|---|---|
| Previous Daily High | 0.6202 |
| Previous Daily Low | 0.6143 |
| Previous Weekly High | 0.6237 |
| Previous Weekly Low | 0.6116 |
| Previous Monthly High | 0.6385 |
| Previous Monthly Low | 0.5985 |
| Daily Fibonacci 38.2% | 0.6165 |
| Daily Fibonacci 61.8% | 0.6179 |
| Daily Pivot Point S1 | 0.6137 |
| Daily Pivot Point S2 | 0.6111 |
| Daily Pivot Point S3 | 0.6078 |
| Daily Pivot Point R1 | 0.6195 |
| Daily Pivot Point R2 | 0.6228 |
| Daily Pivot Point R3 | 0.6254 |
[/s2If]
Nehcap Expert Advisor
The NEHCAP MT4 EA is high quality professional trading system geared to generate returns without using GRID or martingales. Each trade has strict risk per trade parameter. The pairs under management include EURUSD, GBPUSD, AUDCAD, AUDNZD,GBPAUD, EURAUD, EURCAD, CHFJPY and many more.
The system is trading live: LIVE ACCOUNT TRACKING
You can run it free. Apply for a free trial and track our account. Buy the system or use profit share mechanism to generate returns on your MT4.
Join Our Telegram Group
")


