Although the USDMXN currency pair experienced a minor drop of 0.09%, falling to 17.0651, after the Federal Reserve Chair Jerome Powell displayed a more aggressive stance.
…
This is a premium post.
[s2If !current_user_can(access_s2member_level4)]Please register for FREE REGISTER to read full post below containing analysis. In case of any error or you think you are not able to read the full post below, please email us at support#nehcap.com [lwa][/s2If] [s2If current_user_can(access_s2member_level1)]
- Despite Fed Chair Jerome Powell’s hawkish tone, USD/MXN declined to 17.0651, a 0.09% decrease.
The pair currently trades last at 17.0628.
The previous day high was 17.1412 while the previous day low was 17.0544. The daily 38.2% Fib levels comes at 17.0876, expected to provide resistance. Similarly, the daily 61.8% fib level is at 17.1081, expected to provide resistance.
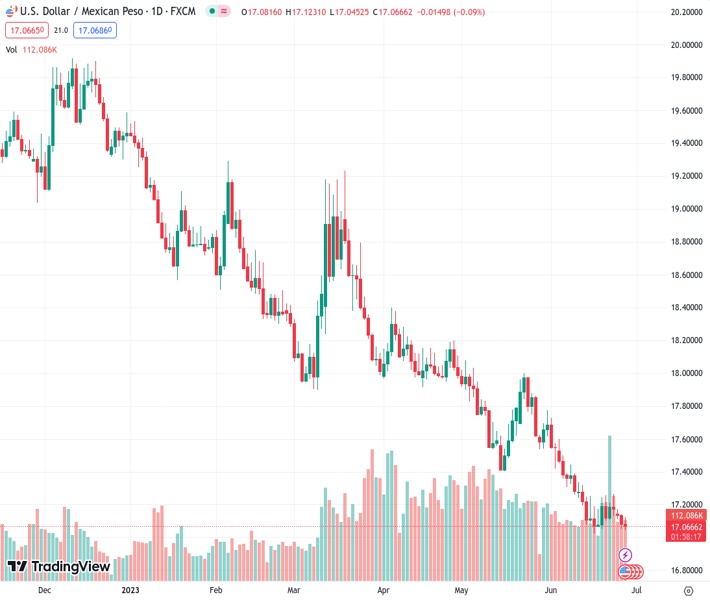
USD/MXN extends its losses past the 17.1000 figure, drops for the fourth consecutive day, after hitting a daily high of 17.1231 amidst hawkish remarks by the US Federal Reserve (Fed) Chair Jerome Powell at a panel hosted by the European Central Bank (ECB). The USD/MXN is trading at 17.0651, down 0.09%.
Wall Street trades mixed, as the S&P and the Dow Jones register minuscule losses amidst the US Government restricting NVIDIA chipmaking availability to China. Meanwhile, Fed Chair Jerome Powell stated that monetary policy “has not been restrictive for long,” highlighting that most Fed policymakers are still seeing additional tightening, as seen in the dot-plots report. Powell commented that the US economy remains resilient, based on the latest data, and downplayed a possible recession. He added that the US central bank needs to see more softening regarding the labor market.
After Powell’s hawkish comments, the USD/MXN did not stop its fall, though it remains slightly above the daily low of 17.0452.
Data-wise, the US Trade deficit contracted by 6.1% to $-91.1 billion, vs. April’s $-97.1 billion, as shown by the US Department of Commerce. Sources cited by Reuters commented, “Even with the narrowing in May, the goods trade deficit is up by over 10% since March, and trade will likely be a drag on economic growth in the second quarter.”
On the Mexican front, an absent economic calendar keeps traders leaning on market sentiment and dynamics surrounding the greenback. The Bank of Mexico (Banxico) decision to hold rates unchanged at 11.25% in the latest monetary policy decision was expected to weaken the Mexican Peso (MXN). But the interest rate differential with other currencies makes the “carry trade” attractive, as Banxico is expected to maintain borrowing costs higher for longer.
Given the backdrop, the USD/MXN downtrend remains intact, influenced by economic factors. The only way the pair could shift gears is a central bank divergence, like Banxico cutting rates while the Fed increases them, shrinking the interest rate differential. Another factor that could derail the MXN from appreciating further would be a recession in the United States (US), which would see increased outflows from emerging markets towards safe-haven assets.
The US economic agenda will disclose Initial Jobless Claims, GDP data, housing data, and a slew of Federal Reserve speakers.
The USD/MXN is downward biased but is trading sideways, capped on the upside by the June 23 high of 17.2644 and by support at the year-to-date (YTD) low of 17.0215. A breach of the latter will expose the 17.00 mark, followed by an October 2015 low of 16.3267. On the other hand, the break above the June 23 high will expose the May 17 low of 17.4038, seen as intermediate resistance, ahead of testing the 50 and 100-day EMAs, each at 17.5409 and 17.9352, respectively.
Technical Levels: Supports and Resistances
USDMXN currently trading at 17.0605 at the time of writing. Pair opened at 17.0858 and is trading with a change of -0.15 % .
| Overview | Overview.1 | |
|---|---|---|
| 0 | Today last price | 17.0605 |
| 1 | Today Daily Change | -0.0253 |
| 2 | Today Daily Change % | -0.1500 |
| 3 | Today daily open | 17.0858 |
The pair remains strongly bearish on the daily time frame. It trades below the 20 SMA @ 17.2742, 50 SMA 17.6005, 100 SMA @ 17.9813 and 200 SMA @ 18.7475.
| Trends | Trends.1 | |
|---|---|---|
| 0 | Daily SMA20 | 17.2742 |
| 1 | Daily SMA50 | 17.6005 |
| 2 | Daily SMA100 | 17.9813 |
| 3 | Daily SMA200 | 18.7475 |
The previous day high was 17.1412 while the previous day low was 17.0544. The daily 38.2% Fib levels comes at 17.0876, expected to provide resistance. Similarly, the daily 61.8% fib level is at 17.1081, expected to provide resistance.
Note the levels of interest below:
- Pivot support is noted at 17.0464, 17.0069, 16.9595
- Pivot resistance is noted at 17.1333, 17.1807, 17.2202
| Levels | Levels.1 |
|---|---|
| Previous Daily High | 17.1412 |
| Previous Daily Low | 17.0544 |
| Previous Weekly High | 17.2656 |
| Previous Weekly Low | 17.0610 |
| Previous Monthly High | 18.0780 |
| Previous Monthly Low | 17.4203 |
| Daily Fibonacci 38.2% | 17.0876 |
| Daily Fibonacci 61.8% | 17.1081 |
| Daily Pivot Point S1 | 17.0464 |
| Daily Pivot Point S2 | 17.0069 |
| Daily Pivot Point S3 | 16.9595 |
| Daily Pivot Point R1 | 17.1333 |
| Daily Pivot Point R2 | 17.1807 |
| Daily Pivot Point R3 | 17.2202 |
[/s2If]
Nehcap Expert Advisor
The NEHCAP MT4 EA is high quality professional trading system geared to generate returns without using GRID or martingales. Each trade has strict risk per trade parameter. The pairs under management include EURUSD, GBPUSD, AUDCAD, AUDNZD,GBPAUD, EURAUD, EURCAD, CHFJPY and many more.
The system is trading live: LIVE ACCOUNT TRACKING
You can run it free. Apply for a free trial and track our account. Buy the system or use profit share mechanism to generate returns on your MT4.
Join Our Telegram Group
")


