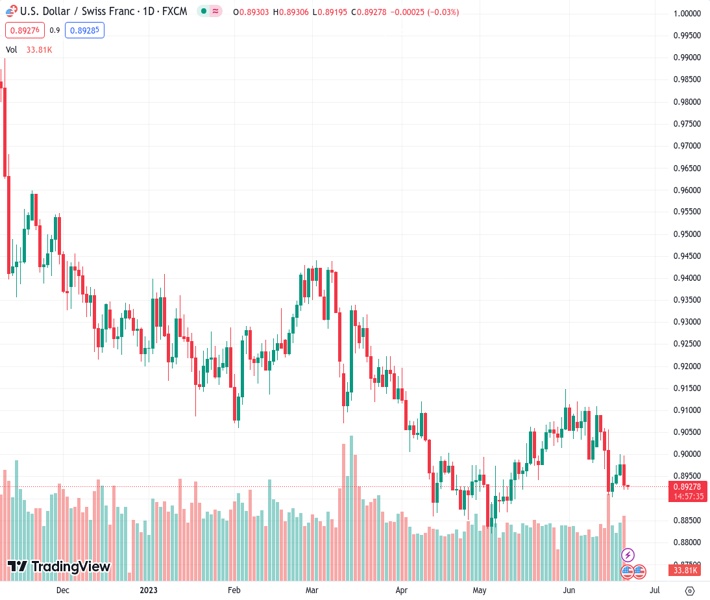
The USDCHF currency pair, currently valued at 0.89284, has gained momentum at the 0.8920 level, mirroring the movement of the USD Index.
…
This is a premium post.
[s2If !current_user_can(access_s2member_level4)]Please register for FREE REGISTER to read full post below containing analysis. In case of any error or you think you are not able to read the full post below, please email us at support#nehcap.com [lwa][/s2If] [s2If current_user_can(access_s2member_level1)]
- USD/CHF has picked strength around 0.8920, following the footprints of the USD Index.
The pair currently trades last at 0.89284.
The previous day high was 0.8998 while the previous day low was 0.892. The daily 38.2% Fib levels comes at 0.895, expected to provide resistance. Similarly, the daily 61.8% fib level is at 0.8968, expected to provide resistance.
The USD/CHF pair has attempted a recovery after building a base around 0.8920 in the early European session. The Swiss Franc asset has picked some strength after observing that the US Dollar Index (DXY) has gauged an intermediate support around 102.00.
The downside momentum in the USD Index has paused for now but is not faded as Federal Reserve (Fed) policymakers have delivered dovish commentary for further interest rate action.
Meanwhile, the interest rate decision by the Swiss National Bank (SNB), which will be announced at 7:30 GMT, will be in focus. A poll from Reuters showed that SNB Chairman Thomas J. Jordan will raise interest rates by 25 basis points (bps) to 1.75% as the central bank believes that it is really important to bring Swiss inflation to a level of price stability.
USD/CHF is declining toward its intermediate support plotted from May 12 low around 0.8900 on a four-hour scale. The 50-period Exponential Moving Average (EMA) at 0.974 has been acting as a barricade for the US Dollar bulls.
The Relative Strength Index (RSI) (14) is oscillating in the bearish range of 20.00-60.00, which indicates that each pullback move in the asset has been capitalized as a selling opportunity by the market participants.
Going forward, a breakdown below May 12 low around 0.8900 would expose the Swiss Franc asset to April 13 low at 0.8860 followed by the ultimate support plotted from May 04 low at 0.8820.
In an alternate scenario, an upside move above the psychological resistance of 0.9000 would fade the bearish bias and will drive the asset toward June 06 low at 0.9033 and May 30 high at 0.9084.
Technical Levels: Supports and Resistances
USDCHF currently trading at 0.8926 at the time of writing. Pair opened at 0.8931 and is trading with a change of -0.06 % .
| Overview | Overview.1 | |
|---|---|---|
| 0 | Today last price | 0.8926 |
| 1 | Today Daily Change | -0.0005 |
| 2 | Today Daily Change % | -0.0600 |
| 3 | Today daily open | 0.8931 |
The pair remains strongly bearish on the daily time frame. It trades below the 20 SMA @ 0.903, 50 SMA 0.8978, 100 SMA @ 0.9103 and 200 SMA @ 0.933.
| Trends | Trends.1 | |
|---|---|---|
| 0 | Daily SMA20 | 0.9030 |
| 1 | Daily SMA50 | 0.8978 |
| 2 | Daily SMA100 | 0.9103 |
| 3 | Daily SMA200 | 0.9330 |
The previous day high was 0.8998 while the previous day low was 0.892. The daily 38.2% Fib levels comes at 0.895, expected to provide resistance. Similarly, the daily 61.8% fib level is at 0.8968, expected to provide resistance.
Note the levels of interest below:
- Pivot support is noted at 0.8901, 0.8871, 0.8822
- Pivot resistance is noted at 0.898, 0.9028, 0.9058
| Levels | Levels.1 |
|---|---|
| Previous Daily High | 0.8998 |
| Previous Daily Low | 0.8920 |
| Previous Weekly High | 0.9109 |
| Previous Weekly Low | 0.8902 |
| Previous Monthly High | 0.9148 |
| Previous Monthly Low | 0.8820 |
| Daily Fibonacci 38.2% | 0.8950 |
| Daily Fibonacci 61.8% | 0.8968 |
| Daily Pivot Point S1 | 0.8901 |
| Daily Pivot Point S2 | 0.8871 |
| Daily Pivot Point S3 | 0.8822 |
| Daily Pivot Point R1 | 0.8980 |
| Daily Pivot Point R2 | 0.9028 |
| Daily Pivot Point R3 | 0.9058 |
[/s2If]
Nehcap Expert Advisor
The NEHCAP MT4 EA is high quality professional trading system geared to generate returns without using GRID or martingales. Each trade has strict risk per trade parameter. The pairs under management include EURUSD, GBPUSD, AUDCAD, AUDNZD,GBPAUD, EURAUD, EURCAD, CHFJPY and many more.
The system is trading live: LIVE ACCOUNT TRACKING
You can run it free. Apply for a free trial and track our account. Buy the system or use profit share mechanism to generate returns on your MT4.
Join Our Telegram Group
")


