The USDCAD pair at a rate of 1.31590 continues to remain low at its nine-month lowest point after experiencing its largest drop in a week.
…
This is a premium post.
[s2If !current_user_can(access_s2member_level4)]Please register for FREE REGISTER to read full post below containing analysis. In case of any error or you think you are not able to read the full post below, please email us at support#nehcap.com [lwa][/s2If] [s2If current_user_can(access_s2member_level1)]
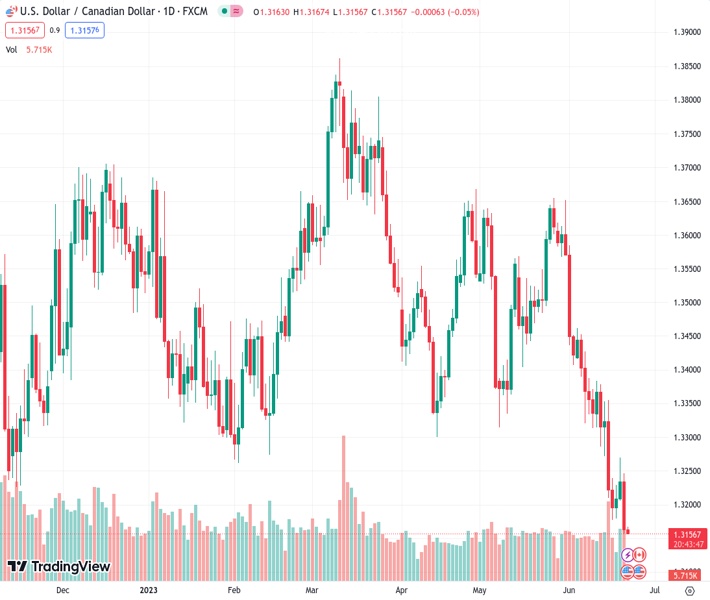
- USD/CAD remains depressed at the lowest level in nine months after falling the most in a week.
The pair currently trades last at 1.31590.
The previous day high was 1.3246 while the previous day low was 1.3157. The daily 38.2% Fib levels comes at 1.3191, expected to provide resistance. Similarly, the daily 61.8% fib level is at 1.3212, expected to provide resistance.
USD/CAD stays on the back foot at the lowest levels since September 2022, after refreshing the yearly low with the biggest daily fall in a week the previous day. That said, the Loonie pair licks its wounds near 1.3160 as markets seek more clues to extend the latest fall amid firmer Oil price and the US Dollar weakness.
US Dollar Index (DXY) printed the first daily loss in four the previous day despite hawkish comments from Federal Reserve (Fed) Chairman Jerome Powell’s bi-annual testimony to the US House Financial Services Committee. The reason could be linked to the absence of any fresh comments, as well as contrasting statements from other Fed Officials.
On Wednesday, Fed’s Powell advocated for raising interest rates somewhat further by year-end. The policymaker also exemplified decelerating a car near the destination while saying, “It may make sense to move rates higher, at a more moderate pace.” Even so, the Fed’s Powell mentioned, “We are very far from our inflation target.” That said, most of the statements from Fed’s Powell were replicas of the last week’s FOMC statement and hence failed to impress the Gold buyers despite weighing on the US Dollar.
It should be noted that comments from Federal Reserve Bank of Chicago President Austan Goolsbee prod US Treasury yields and triggered the US Dollar weakness as he said that the decision last week was a close call for him. The central bank has to “do more sniffing” before another rate hike, Fed’s Goolsbee added.
Elsewhere, WTI crude oil jumped more than 1.0% to refresh the two-week high around $72.70, close to $72.50 by the press time, as hopes of more stimulus from China and increased US refining capacity lured Oil buyers, especially amid downbeat US Dollar. That said, the People’s Bank of China’s (PBoC) rate cut joins the Chinese Ministry of Finance’s announcement of tax incentives to suggest more demand from the world’s biggest commodity user. Additionally, the weekly inventory draw and the first recovery in the US Oil refining capacity, after a two-year downturn, favor the energy buyers.
Alternatively, fears of the global economic slowdown and escalating US-China tension, after Beijing hits back at US President Joe Biden’s criticism of its Chinese counterpart, prod the USD/CAD bears.
Additionally, expectations that Fed Chair Powell may use tactics to convince markets of his hawkish capacity, after failing the previous day, also lures the Loonie pair buyers at the multi-day low.
Failure to extend the bounce off the 1.3180-75 support region directs the USD/CAD bears toward the tops marked in May and June of the last year, close to the 1.3080-75 zone.
Technical Levels: Supports and Resistances
USDCAD currently trading at 1.3161 at the time of writing. Pair opened at 1.3164 and is trading with a change of -0.02% % .
| Overview | Overview.1 | |
|---|---|---|
| 0 | Today last price | 1.3161 |
| 1 | Today Daily Change | -0.0003 |
| 2 | Today Daily Change % | -0.02% |
| 3 | Today daily open | 1.3164 |
The pair remains strongly bearish on the daily time frame. It trades below the 20 SMA @ 1.3393, 50 SMA 1.3453, 100 SMA @ 1.3508 and 200 SMA @ 1.352.
| Trends | Trends.1 | |
|---|---|---|
| 0 | Daily SMA20 | 1.3393 |
| 1 | Daily SMA50 | 1.3453 |
| 2 | Daily SMA100 | 1.3508 |
| 3 | Daily SMA200 | 1.3520 |
The previous day high was 1.3246 while the previous day low was 1.3157. The daily 38.2% Fib levels comes at 1.3191, expected to provide resistance. Similarly, the daily 61.8% fib level is at 1.3212, expected to provide resistance.
Note the levels of interest below:
- Pivot support is noted at 1.3132, 1.31, 1.3044
- Pivot resistance is noted at 1.3221, 1.3278, 1.3309
| Levels | Levels.1 |
|---|---|
| Previous Daily High | 1.3246 |
| Previous Daily Low | 1.3157 |
| Previous Weekly High | 1.3384 |
| Previous Weekly Low | 1.3178 |
| Previous Monthly High | 1.3655 |
| Previous Monthly Low | 1.3315 |
| Daily Fibonacci 38.2% | 1.3191 |
| Daily Fibonacci 61.8% | 1.3212 |
| Daily Pivot Point S1 | 1.3132 |
| Daily Pivot Point S2 | 1.3100 |
| Daily Pivot Point S3 | 1.3044 |
| Daily Pivot Point R1 | 1.3221 |
| Daily Pivot Point R2 | 1.3278 |
| Daily Pivot Point R3 | 1.3309 |
[/s2If]
Nehcap Expert Advisor
The NEHCAP MT4 EA is high quality professional trading system geared to generate returns without using GRID or martingales. Each trade has strict risk per trade parameter. The pairs under management include EURUSD, GBPUSD, AUDCAD, AUDNZD,GBPAUD, EURAUD, EURCAD, CHFJPY and many more.
The system is trading live: LIVE ACCOUNT TRACKING
You can run it free. Apply for a free trial and track our account. Buy the system or use profit share mechanism to generate returns on your MT4.
Join Our Telegram Group
")


