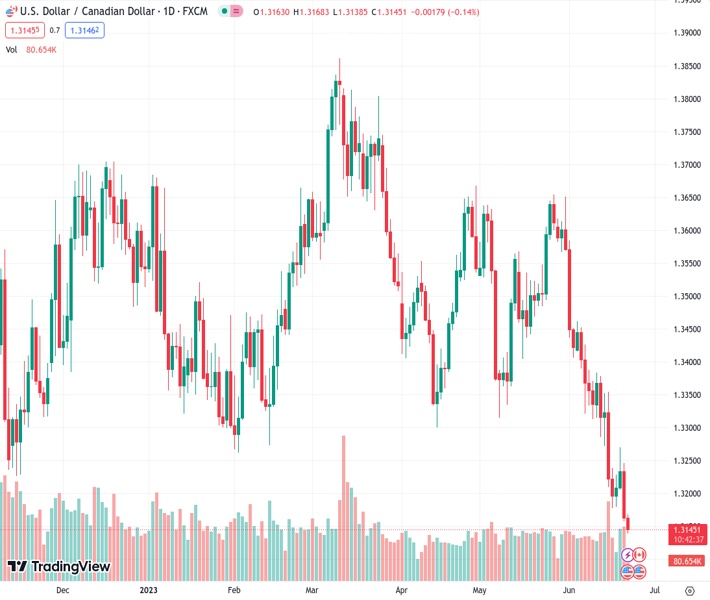
The USDCAD currency pair has reached a new low of 1.3138 which is the lowest it has been in nine months. This is due to the bearish outlook of the USD Index and the Bank of Canada gearing up for additional interest rate increases.
…
This is a premium post.
[s2If !current_user_can(access_s2member_level4)]Please register for FREE REGISTER to read full post below containing analysis. In case of any error or you think you are not able to read the full post below, please email us at support#nehcap.com [lwa][/s2If] [s2If current_user_can(access_s2member_level1)]
- USD/CAD has posted a fresh nine-month low at 1.3138 as USD Index looks bearish and the BoC is preparing for more rate hikes.
The pair currently trades last at 1.31449.
The previous day high was 1.3246 while the previous day low was 1.3157. The daily 38.2% Fib levels comes at 1.3191, expected to provide resistance. Similarly, the daily 61.8% fib level is at 1.3212, expected to provide resistance.
The USD/CAD pair has printed a fresh nine-month low at 1.3138 in the European session. The Loonie asset is facing immense pressure as investors are hoping that upbeat Canadian Retail Sales data has strengthened the chances of more interest rate hikes from the Bank of Canada (BoC).
Downside bias to the Loonie asset is also propelled by weakness in the US Dollar Index (DXY). The US Dollar Index (DXY) is testing territory below 102.00 as investors are expecting only one more rate hike by the Fed this year.
Economists at Rabobank expect the Fed to hike in July, a more moderate pace would imply skipping September and that would leave us with November as the meeting for the second hike. However, even the Fed’s own staff expects the economy to be in a mild recession by then. Therefore, we continue to leave a second hike out of our forecasts.
USD/CAD has faced immense selling pressure after a mean-reversion move to near nine-period Exponential Moving Average (EMA) at 1.3272 on a daily scale. The Lonnie asst has dropped below the horizontal support plotted around 1.3185, which has turned into resistance for the US Dollar bulls.
The Relative Strength Index (RSI) (14) is oscillating in the bearish range of 20.00-40.00 which supports more weakness ahead.
Should the asset break below the intraday low at 1.3139, Canadian Dollar bulls would drag the asset toward 05 July 2022 high at 1.3084 followed by 18 July 2022 high at 1.3033.
On the flip side, a break above June 08 high at 1.3388 will drive the asset toward June 05 high at 1.3462 and the psychological resistance at 1.3500.
Technical Levels: Supports and Resistances
USDCAD currently trading at 1.3144 at the time of writing. Pair opened at 1.3164 and is trading with a change of -0.15 % .
| Overview | Overview.1 | |
|---|---|---|
| 0 | Today last price | 1.3144 |
| 1 | Today Daily Change | -0.0020 |
| 2 | Today Daily Change % | -0.1500 |
| 3 | Today daily open | 1.3164 |
The pair remains strongly bearish on the daily time frame. It trades below the 20 SMA @ 1.3393, 50 SMA 1.3453, 100 SMA @ 1.3508 and 200 SMA @ 1.352.
| Trends | Trends.1 | |
|---|---|---|
| 0 | Daily SMA20 | 1.3393 |
| 1 | Daily SMA50 | 1.3453 |
| 2 | Daily SMA100 | 1.3508 |
| 3 | Daily SMA200 | 1.3520 |
The previous day high was 1.3246 while the previous day low was 1.3157. The daily 38.2% Fib levels comes at 1.3191, expected to provide resistance. Similarly, the daily 61.8% fib level is at 1.3212, expected to provide resistance.
Note the levels of interest below:
- Pivot support is noted at 1.3132, 1.31, 1.3044
- Pivot resistance is noted at 1.3221, 1.3278, 1.3309
| Levels | Levels.1 |
|---|---|
| Previous Daily High | 1.3246 |
| Previous Daily Low | 1.3157 |
| Previous Weekly High | 1.3384 |
| Previous Weekly Low | 1.3178 |
| Previous Monthly High | 1.3655 |
| Previous Monthly Low | 1.3315 |
| Daily Fibonacci 38.2% | 1.3191 |
| Daily Fibonacci 61.8% | 1.3212 |
| Daily Pivot Point S1 | 1.3132 |
| Daily Pivot Point S2 | 1.3100 |
| Daily Pivot Point S3 | 1.3044 |
| Daily Pivot Point R1 | 1.3221 |
| Daily Pivot Point R2 | 1.3278 |
| Daily Pivot Point R3 | 1.3309 |
[/s2If]
Nehcap Expert Advisor
The NEHCAP MT4 EA is high quality professional trading system geared to generate returns without using GRID or martingales. Each trade has strict risk per trade parameter. The pairs under management include EURUSD, GBPUSD, AUDCAD, AUDNZD,GBPAUD, EURAUD, EURCAD, CHFJPY and many more.
The system is trading live: LIVE ACCOUNT TRACKING
You can run it free. Apply for a free trial and track our account. Buy the system or use profit share mechanism to generate returns on your MT4.
Join Our Telegram Group
")


