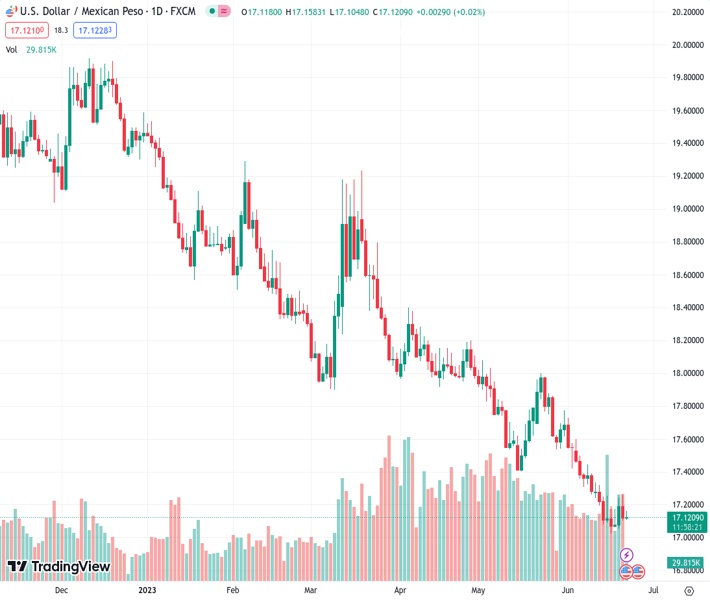
On Thursday, the USDMXN currency pair had a rebound in a favorable direction at a rate of 17.1219, however, it did not persist with any further momentum.
…
This is a premium post.
[s2If !current_user_can(access_s2member_level4)]Please register for FREE REGISTER to read full post below containing analysis. In case of any error or you think you are not able to read the full post below, please email us at support#nehcap.com [lwa][/s2If] [s2If current_user_can(access_s2member_level1)]
- USD/MXN regain positive traction on Thursday, albeit lacks any follow-through.
The pair currently trades last at 17.1219.
The previous day high was 17.2576 while the previous day low was 17.106. The daily 38.2% Fib levels comes at 17.1639, expected to provide resistance. Similarly, the daily 61.8% fib level is at 17.1997, expected to provide resistance.
The USD/MXN pair attracts some buying on Thursday and reverses a part of the previous day’s retracement slide from over a one-week high, around the 17.2575 area. Spot prices trade with a mild positive bias just below the 17.15 level through the early part of the European session, albeit seems to lack follow-through.
From a technical perspective, the overnight failure near a hurdle marked by the top end of a descending channel, extending from the 18.00, or the May swing high, warrants caution for bullish traders. Moreover, oscillators on the daily chart are holding deep in the bearish territory and have also recovered from the overbought zone. This makes it prudent to wait for a convincing break through the descending channel resistance, currently around the 17.2320-17.2325 area, before confirming that the USD/MXN pair has formed a near-term bottom.
The subsequent move-up has the potential to lift spot prices to the 100-period Simple Moving Average (SMA) hurdle near the 17.3200 area. Some follow-through buying will set the stage for a meaningful near-term recovery towards the 17.4265-17.4270 area en route to the 17.5020-17.5025 region and the next relevant resistance around the 17.6000 level.
On the flip side, the 17.0560-17.0555 region now seems to protect the immediate downside ahead of the multi-year low, around the 17.0245-17.0240 area. This is followed by the 17.00 psychological mark and the descending trend-channel support, which if broken decisively will be seen as a fresh trigger for bearish traders. The USD/MXN pair might then turn vulnerable to accelerate the fall towards the 16.60-16.55 zone before dropping to the November 2015 swing low, around the 16.35 region.
Technical Levels: Supports and Resistances
USDMXN currently trading at 17.139 at the time of writing. Pair opened at 17.119 and is trading with a change of 0.12 % .
| Overview | Overview.1 | |
|---|---|---|
| 0 | Today last price | 17.139 |
| 1 | Today Daily Change | 0.020 |
| 2 | Today Daily Change % | 0.120 |
| 3 | Today daily open | 17.119 |
The pair remains strongly bearish on the daily time frame. It trades below the 20 SMA @ 17.3815, 50 SMA 17.6709, 100 SMA @ 18.0521 and 200 SMA @ 18.8047.
| Trends | Trends.1 | |
|---|---|---|
| 0 | Daily SMA20 | 17.3815 |
| 1 | Daily SMA50 | 17.6709 |
| 2 | Daily SMA100 | 18.0521 |
| 3 | Daily SMA200 | 18.8047 |
The previous day high was 17.2576 while the previous day low was 17.106. The daily 38.2% Fib levels comes at 17.1639, expected to provide resistance. Similarly, the daily 61.8% fib level is at 17.1997, expected to provide resistance.
Note the levels of interest below:
- Pivot support is noted at 17.0642, 17.0094, 16.9127
- Pivot resistance is noted at 17.2157, 17.3124, 17.3673
| Levels | Levels.1 |
|---|---|
| Previous Daily High | 17.2576 |
| Previous Daily Low | 17.1060 |
| Previous Weekly High | 17.3353 |
| Previous Weekly Low | 17.0243 |
| Previous Monthly High | 18.0780 |
| Previous Monthly Low | 17.4203 |
| Daily Fibonacci 38.2% | 17.1639 |
| Daily Fibonacci 61.8% | 17.1997 |
| Daily Pivot Point S1 | 17.0642 |
| Daily Pivot Point S2 | 17.0094 |
| Daily Pivot Point S3 | 16.9127 |
| Daily Pivot Point R1 | 17.2157 |
| Daily Pivot Point R2 | 17.3124 |
| Daily Pivot Point R3 | 17.3673 |
[/s2If]
Nehcap Expert Advisor
The NEHCAP MT4 EA is high quality professional trading system geared to generate returns without using GRID or martingales. Each trade has strict risk per trade parameter. The pairs under management include EURUSD, GBPUSD, AUDCAD, AUDNZD,GBPAUD, EURAUD, EURCAD, CHFJPY and many more.
The system is trading live: LIVE ACCOUNT TRACKING
You can run it free. Apply for a free trial and track our account. Buy the system or use profit share mechanism to generate returns on your MT4.
Join Our Telegram Group
")


