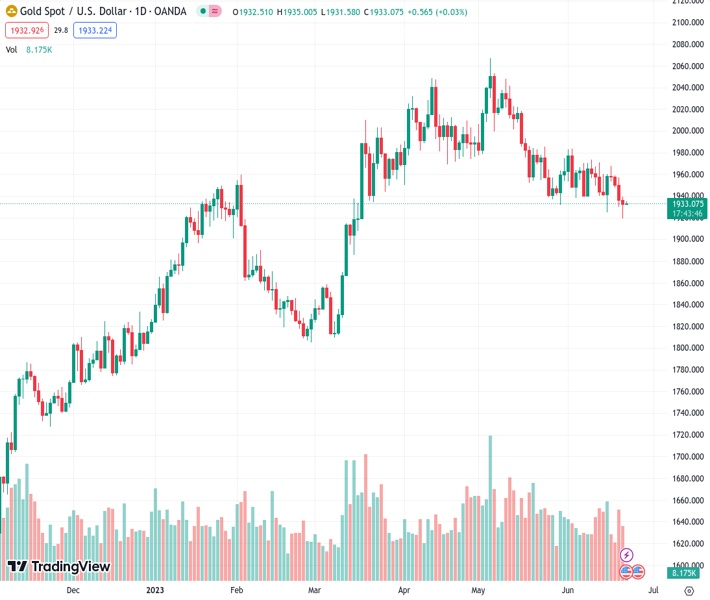
During the Asian trading session, the price of gold, represented by #XAUUSD @ 1,933.27, moved within a small range of trading, remaining below the 100-day SMA.
…
This is a premium post.
[s2If !current_user_can(access_s2member_level4)]Please register for FREE REGISTER to read full post below containing analysis. In case of any error or you think you are not able to read the full post below, please email us at support#nehcap.com [lwa][/s2If] [s2If current_user_can(access_s2member_level1)]
- Gold price oscillates in a narrow trading band below the 100-day SMA through the Asian session.
The pair currently trades last at 1933.27.
The previous day high was 1939.54 while the previous day low was 1919.23. The daily 38.2% Fib levels comes at 1926.99, expected to provide support. Similarly, the daily 61.8% fib level is at 1931.78, expected to provide support.
Gold price struggles to capitalize on the overnight bounce from the $1,919 region, or its lowest level since March 17 and oscillates in a narrow trading band through the Asian session on Thursday. The XAU/USD currently trades around the $1,933 area, nearly unchanged for the day, and seems vulnerable to slide further.
Worries about a global economic downturn continue to weigh on investors’ sentiment, which is evident from a generally weaker tone around the equity markets. Apart from this, subdued US Dollar (USD) demand is seen as another factor lending some support to the safe-haven Gold price. In fact, the USD Index (DXY), which tracks the Greenback against a basket of currencies, languishes near the monthly low in the wake of the uncertainty over the Federal Reserve’s (Fed) rate hike path.
In fact, Fed Chair Jerome Powell, testifying before the House Financial Services Committee on Wednesday, noted that inflation remains very far from the Fed’s target, though it may make sense to raise rates at a more moderate pace. Powell, however, added that the fight against inflation is still not over and despite a recent pause, officials agreed borrowing costs would likely need to move higher. This, in turn, reinforced expectations for at least a 25-basis point (bps) hike in July.
Adding to this, a more hawkish outlook by other major central banks keeps investors wary of the non-yielding Gold price. It is worth recalling that the Reserve Bank of Australia (RBA) and the Bank of Canada (BoC) delivered a surprise 25 bps hike earlier this month. Moreover, the European Central Bank (ECB) lifted rates to the highest level in 22 years, while the Bank of England (BoE) and the Swiss National Bank (SNB) are also expected to hike interest rates this Thursday.
This, in turn, suggests that the path of least resistance for Gold price is to the downside and should hold back bullish traders from placing aggressive bets. Market participants now look to Powell’s second day of testimony before the Senate Banking Committee. Any signals on monetary policy will influence the USD and will likely affect Gold prices. Traders on Thursday will further take cues from the Weekly Initial Jobless Claims and Existing Home Sales data from the United States (US).
From a technical perspective, the back-to-back closer below the 100-day Simple Moving Average (SMA) could be seen as a fresh trigger for bearish traders and adds credence to the negative outlook. Moreover, oscillators on the daily chart are holding in the bearish territory and are still far from being in the oversold zone. This, in turn, suggests that the path of least resistance for the Gold price is to the downside. Some follow-through selling below the overnight swing low, around the $1,919 area, will reaffirm the bearish bias and drag the XAU/USD towards the $1,900 mark. The downward trajectory could get extended further towards the $1,876-$1,875 horizontal support before the XAU/USD eventually drops to the very important 200-day SMA, currently around the $1,840 region.
On the flip side, the 100-day SMA, currently pegged around the $1,942 zone, now seems to act as an immediate strong barrier. Any subsequent move beyond might continue to attract fresh supply and remain capped near the $1,962-$1,964 region. The next relevant hurdle is seen near the $1,970-$1,972 zone ahead of the $1,983-$1,985 region. A sustained strength beyond the said barriers might trigger a fresh bout of a short-covering move, allowing the Gold price to surpass the $2,000 psychological mark and climb further towards the $2,010-$2,012 resistance.
Technical Levels: Supports and Resistances
XAUUSD currently trading at 1932.41 at the time of writing. Pair opened at 1932.39 and is trading with a change of 0.0 % .
| Overview | Overview.1 | |
|---|---|---|
| 0 | Today last price | 1932.41 |
| 1 | Today Daily Change | 0.02 |
| 2 | Today Daily Change % | 0.00 |
| 3 | Today daily open | 1932.39 |
The pair is trading below its 20 Daily moving average @ 1952.53, below its 50 Daily moving average @ 1981.5 , below its 100 Daily moving average @ 1942.49 and above its 200 Daily moving average @ 1851.01
| Trends | Trends.1 | |
|---|---|---|
| 0 | Daily SMA20 | 1952.53 |
| 1 | Daily SMA50 | 1981.50 |
| 2 | Daily SMA100 | 1942.49 |
| 3 | Daily SMA200 | 1851.01 |
The previous day high was 1939.54 while the previous day low was 1919.23. The daily 38.2% Fib levels comes at 1926.99, expected to provide support. Similarly, the daily 61.8% fib level is at 1931.78, expected to provide support.
Note the levels of interest below:
- Pivot support is noted at 1921.23, 1910.08, 1900.92
- Pivot resistance is noted at 1941.54, 1950.7, 1961.85
| Levels | Levels.1 |
|---|---|
| Previous Daily High | 1939.54 |
| Previous Daily Low | 1919.23 |
| Previous Weekly High | 1971.01 |
| Previous Weekly Low | 1924.85 |
| Previous Monthly High | 2079.76 |
| Previous Monthly Low | 1932.12 |
| Daily Fibonacci 38.2% | 1926.99 |
| Daily Fibonacci 61.8% | 1931.78 |
| Daily Pivot Point S1 | 1921.23 |
| Daily Pivot Point S2 | 1910.08 |
| Daily Pivot Point S3 | 1900.92 |
| Daily Pivot Point R1 | 1941.54 |
| Daily Pivot Point R2 | 1950.70 |
| Daily Pivot Point R3 | 1961.85 |
[/s2If]
Nehcap Expert Advisor
The NEHCAP MT4 EA is high quality professional trading system geared to generate returns without using GRID or martingales. Each trade has strict risk per trade parameter. The pairs under management include EURUSD, GBPUSD, AUDCAD, AUDNZD,GBPAUD, EURAUD, EURCAD, CHFJPY and many more.
The system is trading live: LIVE ACCOUNT TRACKING
You can run it free. Apply for a free trial and track our account. Buy the system or use profit share mechanism to generate returns on your MT4.
Join Our Telegram Group
")


