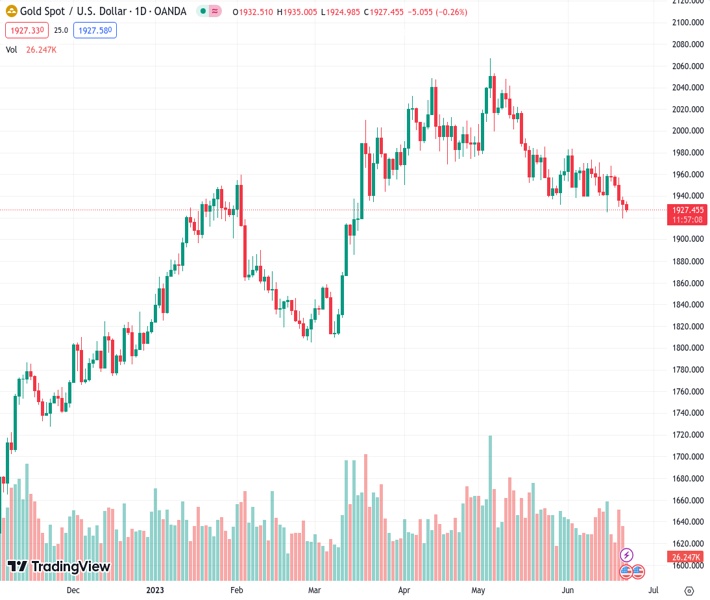
Confusion over the Federal Reserve’s future interest rate policy has caused the price of gold to become erratic, with XAUUSD currently at 1,927.83 and hovering around $1,930.00.
…
This is a premium post.
[s2If !current_user_can(access_s2member_level4)]Please register for FREE REGISTER to read full post below containing analysis. In case of any error or you think you are not able to read the full post below, please email us at support#nehcap.com [lwa][/s2If] [s2If current_user_can(access_s2member_level1)]
- Gold price has turned topsy-turvy around $1,930.00 as investors get baffled about further interest rate policy by the Fed.
The pair currently trades last at 1927.83.
The previous day high was 1939.54 while the previous day low was 1919.23. The daily 38.2% Fib levels comes at 1926.99, expected to provide support. Similarly, the daily 61.8% fib level is at 1931.78, expected to provide resistance.
Gold price (XAU/USD) is demonstrating topsy-turvy moves around $1,930.00 in the European session. The precious metal is displaying a non-directional performance as investors have been baffled while assessing hawkish Federal Reserve (Fed) chair Jerome Powell’s hawkish testimony and dovish commentary from Atlanta Fed President Raphael Bostic.
S&P500 futures are showing significant losses in Europe as investors are getting anxious. Caution in the United States market is deepening as the quarterly result season is going to kick off sooner. Technology stocks witnessed extreme pressure as investors are hoping the giant tech-savvy stocks would continue to provide weak guidance due to higher interest rates from the Fed.
The US Dollar Index (DXY) has retreated after a less-confident recovery move to near 102.16 as the impact of dovish commentary from Fed Bostic and Chicago Fed Bank President Austan Goolsbee has faded the impact of Jerome Powell’s hawkish testimony. Contrary to USD Index, the Treasury yields have rebounded sharply. The 10-year US Treasury Yields have jumped to near 3.75%.
Fed Bostic cited that the central bank should not raise interest rates further or it would risk “needlessly” sapping the strength of the economy. While Chicago Fed Bank President Austan Goolsbee favored allowing current interest rates required time to show their impact on the economy.
Gold price is consistently defending the horizontal support of the Descending Triangle chart pattern formed on a two-hour scale, which is placed from May 30 low at $1,932.12. The downward-sloping trendline of the aforementioned chart pattern is plotted from June 02 high at $1,983.00. The 200-period Exponential Moving Average (EMA) at $1,953.62 is acting as a barricade for the Gold bulls. Horizontal resistance is plotted from May 05 low around $2,000.00.
The Relative Strength Index (RSI) (14) is oscillating in the bearish range of 20.00-40.00, which indicates that the downside momentum has been triggered.
Technical Levels: Supports and Resistances
XAUUSD currently trading at 1928.24 at the time of writing. Pair opened at 1932.39 and is trading with a change of -0.21 % .
| Overview | Overview.1 | |
|---|---|---|
| 0 | Today last price | 1928.24 |
| 1 | Today Daily Change | -4.15 |
| 2 | Today Daily Change % | -0.21 |
| 3 | Today daily open | 1932.39 |
The pair is trading below its 20 Daily moving average @ 1952.53, below its 50 Daily moving average @ 1981.5 , below its 100 Daily moving average @ 1942.49 and above its 200 Daily moving average @ 1851.01
| Trends | Trends.1 | |
|---|---|---|
| 0 | Daily SMA20 | 1952.53 |
| 1 | Daily SMA50 | 1981.50 |
| 2 | Daily SMA100 | 1942.49 |
| 3 | Daily SMA200 | 1851.01 |
The previous day high was 1939.54 while the previous day low was 1919.23. The daily 38.2% Fib levels comes at 1926.99, expected to provide support. Similarly, the daily 61.8% fib level is at 1931.78, expected to provide resistance.
Note the levels of interest below:
- Pivot support is noted at 1921.23, 1910.08, 1900.92
- Pivot resistance is noted at 1941.54, 1950.7, 1961.85
| Levels | Levels.1 |
|---|---|
| Previous Daily High | 1939.54 |
| Previous Daily Low | 1919.23 |
| Previous Weekly High | 1971.01 |
| Previous Weekly Low | 1924.85 |
| Previous Monthly High | 2079.76 |
| Previous Monthly Low | 1932.12 |
| Daily Fibonacci 38.2% | 1926.99 |
| Daily Fibonacci 61.8% | 1931.78 |
| Daily Pivot Point S1 | 1921.23 |
| Daily Pivot Point S2 | 1910.08 |
| Daily Pivot Point S3 | 1900.92 |
| Daily Pivot Point R1 | 1941.54 |
| Daily Pivot Point R2 | 1950.70 |
| Daily Pivot Point R3 | 1961.85 |
[/s2If]
Nehcap Expert Advisor
The NEHCAP MT4 EA is high quality professional trading system geared to generate returns without using GRID or martingales. Each trade has strict risk per trade parameter. The pairs under management include EURUSD, GBPUSD, AUDCAD, AUDNZD,GBPAUD, EURAUD, EURCAD, CHFJPY and many more.
The system is trading live: LIVE ACCOUNT TRACKING
You can run it free. Apply for a free trial and track our account. Buy the system or use profit share mechanism to generate returns on your MT4.
Join Our Telegram Group
")


