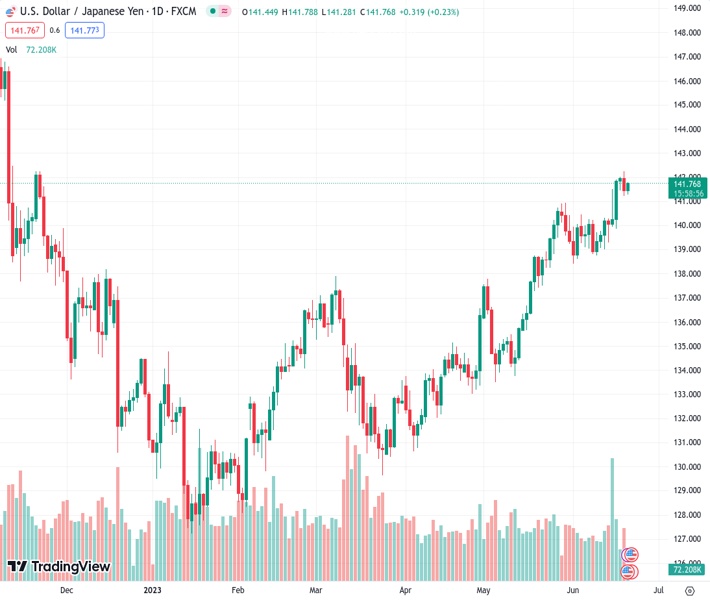
There is an increase in demand for USDJPY at a price of 141.764 which is causing a reversal of the decrease experienced the previous day after reaching the highest levels it has in seven months. In the opinion of @nehcap, there is an anticipated rise in the value of the currency pair.
…
This is a premium post.
[s2If !current_user_can(access_s2member_level4)]Please register for FREE REGISTER to read full post below containing analysis. In case of any error or you think you are not able to read the full post below, please email us at support#nehcap.com [lwa][/s2If] [s2If current_user_can(access_s2member_level1)]
- USD/JPY picks up bids to reverse the previous day’s retreat from the highest levels in seven months.
The pair currently trades last at 141.764.
The previous day high was 142.25 while the previous day low was 141.21. The daily 38.2% Fib levels comes at 141.61, expected to provide support. Similarly, the daily 61.8% fib level is at 141.86, expected to provide resistance.
USD/JPY regains upside momentum, after reversing from the yearly top the previous day, as it makes rounds to the intraday high of around 141.75 heading into Wednesday’s European session.
In doing so, the Yen pair cheers the latest breakout of an immediate resistance line stretched from the yearly top marked on Monday while bouncing off the 141.40 support confluence comprising the 100-Hour Moving Average (HMA) and lower line of a one-week-old rising wedge.
It’s worth observing that the bullish MACD signals and the firmer RSI (14) line, not overbought, add strength to the upside bias about the USD/JPY pair.
With this, the risk barometer pair is all set to approach the yearly peak surrounding 142.25, with the 142.00 round figure acting as immediate resistance.
However, the aforementioned rising wedge’s top line, close to 142.55 by the press time, restricts the Yen pair’s advances past 142.25.
In a case where the USD/JPY bulls manage to defy the bearish chart pattern by crossing the 142.55 resistance, they can aim for a horizontal area surrounding 145.00 that encompasses the early September 2022 top and the last October’s bottom.
On the flip side, a downside break of the 141.40 support confluence isn’t an open welcome for the USD/JPY bears as the 200-HMA and a fortnight-long rising trend line, close to 140.50 and 139.80 in that order, could check the sellers.
Trend: Further upside expected
Technical Levels: Supports and Resistances
USDJPY currently trading at 141.7 at the time of writing. Pair opened at 141.49 and is trading with a change of 0.15% % .
| Overview | Overview.1 | |
|---|---|---|
| 0 | Today last price | 141.7 |
| 1 | Today Daily Change | 0.21 |
| 2 | Today Daily Change % | 0.15% |
| 3 | Today daily open | 141.49 |
The pair remains strongly bullish on the daily timeframe. It trades above its 20 SMA @ 140.09, 50 SMA 137.23, 100 SMA @ 135.24 and 200 SMA @ 137.22.
| Trends | Trends.1 | |
|---|---|---|
| 0 | Daily SMA20 | 140.09 |
| 1 | Daily SMA50 | 137.23 |
| 2 | Daily SMA100 | 135.24 |
| 3 | Daily SMA200 | 137.22 |
The previous day high was 142.25 while the previous day low was 141.21. The daily 38.2% Fib levels comes at 141.61, expected to provide support. Similarly, the daily 61.8% fib level is at 141.86, expected to provide resistance.
Note the levels of interest below:
- Pivot support is noted at 141.05, 140.61, 140.01
- Pivot resistance is noted at 142.09, 142.69, 143.13
| Levels | Levels.1 |
|---|---|
| Previous Daily High | 142.25 |
| Previous Daily Low | 141.21 |
| Previous Weekly High | 141.92 |
| Previous Weekly Low | 139.01 |
| Previous Monthly High | 140.93 |
| Previous Monthly Low | 133.50 |
| Daily Fibonacci 38.2% | 141.61 |
| Daily Fibonacci 61.8% | 141.86 |
| Daily Pivot Point S1 | 141.05 |
| Daily Pivot Point S2 | 140.61 |
| Daily Pivot Point S3 | 140.01 |
| Daily Pivot Point R1 | 142.09 |
| Daily Pivot Point R2 | 142.69 |
| Daily Pivot Point R3 | 143.13 |
[/s2If]
Nehcap Expert Advisor
The NEHCAP MT4 EA is high quality professional trading system geared to generate returns without using GRID or martingales. Each trade has strict risk per trade parameter. The pairs under management include EURUSD, GBPUSD, AUDCAD, AUDNZD,GBPAUD, EURAUD, EURCAD, CHFJPY and many more.
The system is trading live: LIVE ACCOUNT TRACKING
You can run it free. Apply for a free trial and track our account. Buy the system or use profit share mechanism to generate returns on your MT4.
Join Our Telegram Group
")


