The value of XAGUSD drops below the critical level of $22.96, which also happens to be the level of the 200-day EMA.
…
This is a premium post.
[s2If !current_user_can(access_s2member_level4)]Please register for FREE REGISTER to read full post below containing analysis. In case of any error or you think you are not able to read the full post below, please email us at support#nehcap.com [lwa][/s2If] [s2If current_user_can(access_s2member_level1)]
- XAG/USD sinks below key $22.96, the 200-day EMA level.
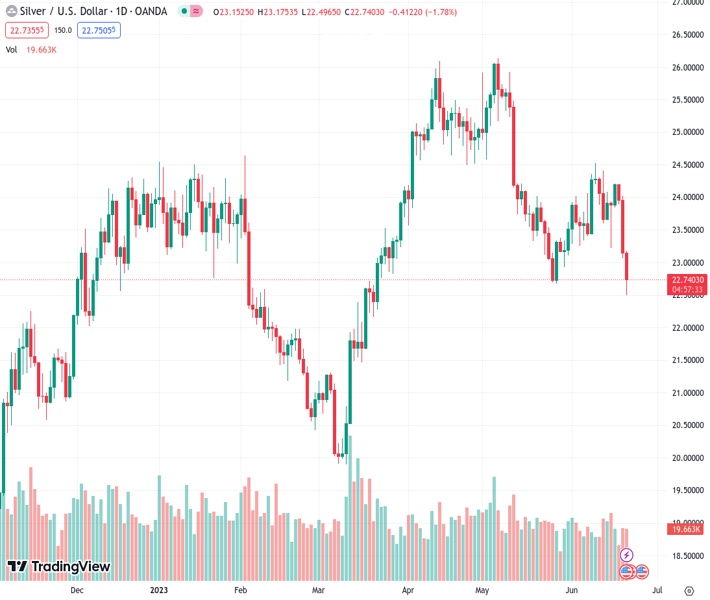
The pair currently trades last at 22.750.
The previous day high was 24.03 while the previous day low was 23.06. The daily 38.2% Fib levels comes at 23.43, expected to provide resistance. Similarly, the daily 61.8% fib level is at 23.66, expected to provide resistance.
Silver price pierces below the 200-day Exponential Moving Average (EMA) of $22.96 as sellers pile in, dragging prices towards a new two-month low of $22.50, as high US Treasury bond yields pressure the precious metals segment. At the time of writing, XAG/USD trades at $22.75, while Gold (XAU/USD) spot exchanges hands at $1931.02, down 1.64% and 0.23%, respectively.
Risk-off sentiment is weighing on the precious metals segment. Investors remain uncertain as the Fed Chair Jerome Powell commences his two-day testimony at the US Congress, which you can follow here. The US 10-year Treasury note yields 3.775% and gains 4.6 bps, while US real yields, directly influencing XAG/USD’s prices, climb five bps to 1.555%.
The XAG/USD remains neutral to downward biased, though it could shift to the downside if XAG/USD prints a daily close below the May 25 swing low of $22.68. That would mean the Silver price breaking the 200-day Exponential Moving Average (EMA) threshold and, from a technical perspective, turning XAG/USD bearish.
Further cementing XAG/USD bearish case is the Relative Strength Index (RSI) indicator at negative territory, while the three-day Rate of Change (RoC) continues to plunge as sellers gain momentum.
That said, in that outcome, XAG/USD could dive towards the March 21 daily low at $22.14 before challenging the $22.00 figure. A breach of the latter will expose the March 16 low at $21.47, followed by the $21.00 mark.
Conversely, if XAG/USD reclaims the 200-day EMA, that could expose the $23.00 handle on the upside, followed by the 100-day EMA at $23.52.
Technical Levels: Supports and Resistances
XAGUSD currently trading at 22.73 at the time of writing. Pair opened at 23.18 and is trading with a change of -1.94 % .
| Overview | Overview.1 | |
|---|---|---|
| 0 | Today last price | 22.73 |
| 1 | Today Daily Change | -0.45 |
| 2 | Today Daily Change % | -1.94 |
| 3 | Today daily open | 23.18 |
The pair is trading below its 20 Daily moving average @ 23.63, below its 50 Daily moving average @ 24.37 , below its 100 Daily moving average @ 23.36 and above its 200 Daily moving average @ 22.44
| Trends | Trends.1 | |
|---|---|---|
| 0 | Daily SMA20 | 23.63 |
| 1 | Daily SMA50 | 24.37 |
| 2 | Daily SMA100 | 23.36 |
| 3 | Daily SMA200 | 22.44 |
The previous day high was 24.03 while the previous day low was 23.06. The daily 38.2% Fib levels comes at 23.43, expected to provide resistance. Similarly, the daily 61.8% fib level is at 23.66, expected to provide resistance.
Note the levels of interest below:
- Pivot support is noted at 22.81, 22.45, 21.84
- Pivot resistance is noted at 23.78, 24.39, 24.75
| Levels | Levels.1 |
|---|---|
| Previous Daily High | 24.03 |
| Previous Daily Low | 23.06 |
| Previous Weekly High | 24.40 |
| Previous Weekly Low | 23.22 |
| Previous Monthly High | 26.14 |
| Previous Monthly Low | 22.68 |
| Daily Fibonacci 38.2% | 23.43 |
| Daily Fibonacci 61.8% | 23.66 |
| Daily Pivot Point S1 | 22.81 |
| Daily Pivot Point S2 | 22.45 |
| Daily Pivot Point S3 | 21.84 |
| Daily Pivot Point R1 | 23.78 |
| Daily Pivot Point R2 | 24.39 |
| Daily Pivot Point R3 | 24.75 |
[/s2If]
Nehcap Expert Advisor
The NEHCAP MT4 EA is high quality professional trading system geared to generate returns without using GRID or martingales. Each trade has strict risk per trade parameter. The pairs under management include EURUSD, GBPUSD, AUDCAD, AUDNZD,GBPAUD, EURAUD, EURCAD, CHFJPY and many more.
The system is trading live: LIVE ACCOUNT TRACKING
You can run it free. Apply for a free trial and track our account. Buy the system or use profit share mechanism to generate returns on your MT4.
Join Our Telegram Group
")


