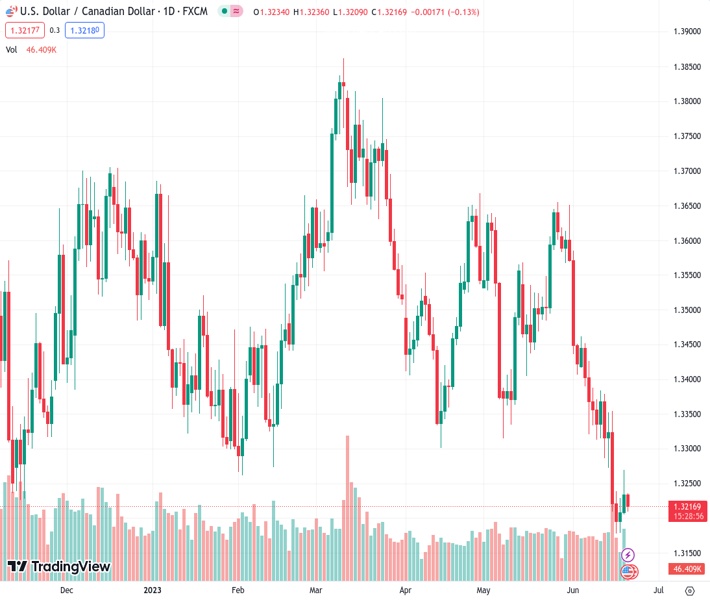
The USDCAD currency pair at a rate of 1.32158 is experiencing a decrease after a brief recovery from its lowest point in nine months, and has reached a new low for the day.
…
This is a premium post.
[s2If !current_user_can(access_s2member_level4)]Please register for FREE REGISTER to read full post below containing analysis. In case of any error or you think you are not able to read the full post below, please email us at support#nehcap.com [lwa][/s2If] [s2If current_user_can(access_s2member_level1)]
- USD/CAD fades bounce off the lowest levels in nine months, renews intraday low of late.
The pair currently trades last at 1.32158.
The previous day high was 1.327 while the previous day low was 1.3206. The daily 38.2% Fib levels comes at 1.3245, expected to provide resistance. Similarly, the daily 61.8% fib level is at 1.323, expected to provide resistance.
USD/CAD prints the first daily loss in three around 1.3210 as it braces for the top-tier Canada and the US catalysts ahead of Wednesday’s European session. In doing so, the Loonie pair justifies the recently firmer price of WTI crude oil, Canada’s key export item, as well as the inactive US Dollar Index (DXY).
That said, the DXY struggles to extend the four-day downtrend amid mixed concerns about the Fed and the US-China tussle. Also likely to challenge the USD/CAD buyers, as well as favor the Oil Price recovery, could be China’s latest efforts to tame the recession woes, recently by the People’s Bank of China (PBoC) rate cut and Ministry of Finance’s (MoF) announcement of cutting the purchase tax during 2024-25 and 2026-27.
On the other hand, the geopolitical fears surrounding the US and China weigh on the sentiment and put a floor under the US Dollar’s haven demand. Recently, China’s Ministry of Foreign Affairs (MoFA) said that the US has distorted its political promise to China. Late on Tuesday, US President Joe Biden termed Chinese President Xi Jinping a dictator and flagged concerns of intense Sino-American tension earlier in the day.
Additionally, hawkish comments from the Fed policymakers, mainly the nominees, and strong US housing data also allowed the USD/CAD bears to remain sidelined despite retaking control.
Against this backdrop, the US Dollar Index (DXY) stays defensive around 102.60 while keeping the four-day uptrend without marking keen interest to move toward the north. Additionally, WTI crude oil prints the first daily gains in three around $71.60 while &P500 Futures pause the week-start retreat from the highest levels in 14 months.
Moving on, Canada’s monthly Retail Sales for April will precede Fed Chair Jerome Powell’s bi-annual testimony to entertain traders.
USD/CAD retreats from a three-week-old resistance line, around 1.3245 by the press time, as bears approach the yearly low marked earlier in the week surrounding 1.3180.
Technical Levels: Supports and Resistances
USDCAD currently trading at 1.3214 at the time of writing. Pair opened at 1.3235 and is trading with a change of -0.16% % .
| Overview | Overview.1 | |
|---|---|---|
| 0 | Today last price | 1.3214 |
| 1 | Today Daily Change | -0.0021 |
| 2 | Today Daily Change % | -0.16% |
| 3 | Today daily open | 1.3235 |
The pair remains strongly bearish on the daily time frame. It trades below the 20 SMA @ 1.3414, 50 SMA 1.3459, 100 SMA @ 1.351 and 200 SMA @ 1.352.
| Trends | Trends.1 | |
|---|---|---|
| 0 | Daily SMA20 | 1.3414 |
| 1 | Daily SMA50 | 1.3459 |
| 2 | Daily SMA100 | 1.3510 |
| 3 | Daily SMA200 | 1.3520 |
The previous day high was 1.327 while the previous day low was 1.3206. The daily 38.2% Fib levels comes at 1.3245, expected to provide resistance. Similarly, the daily 61.8% fib level is at 1.323, expected to provide resistance.
Note the levels of interest below:
- Pivot support is noted at 1.3204, 1.3173, 1.314
- Pivot resistance is noted at 1.3268, 1.3301, 1.3332
| Levels | Levels.1 |
|---|---|
| Previous Daily High | 1.3270 |
| Previous Daily Low | 1.3206 |
| Previous Weekly High | 1.3384 |
| Previous Weekly Low | 1.3178 |
| Previous Monthly High | 1.3655 |
| Previous Monthly Low | 1.3315 |
| Daily Fibonacci 38.2% | 1.3245 |
| Daily Fibonacci 61.8% | 1.3230 |
| Daily Pivot Point S1 | 1.3204 |
| Daily Pivot Point S2 | 1.3173 |
| Daily Pivot Point S3 | 1.3140 |
| Daily Pivot Point R1 | 1.3268 |
| Daily Pivot Point R2 | 1.3301 |
| Daily Pivot Point R3 | 1.3332 |
[/s2If]
Nehcap Expert Advisor
The NEHCAP MT4 EA is high quality professional trading system geared to generate returns without using GRID or martingales. Each trade has strict risk per trade parameter. The pairs under management include EURUSD, GBPUSD, AUDCAD, AUDNZD,GBPAUD, EURAUD, EURCAD, CHFJPY and many more.
The system is trading live: LIVE ACCOUNT TRACKING
You can run it free. Apply for a free trial and track our account. Buy the system or use profit share mechanism to generate returns on your MT4.
Join Our Telegram Group
")


