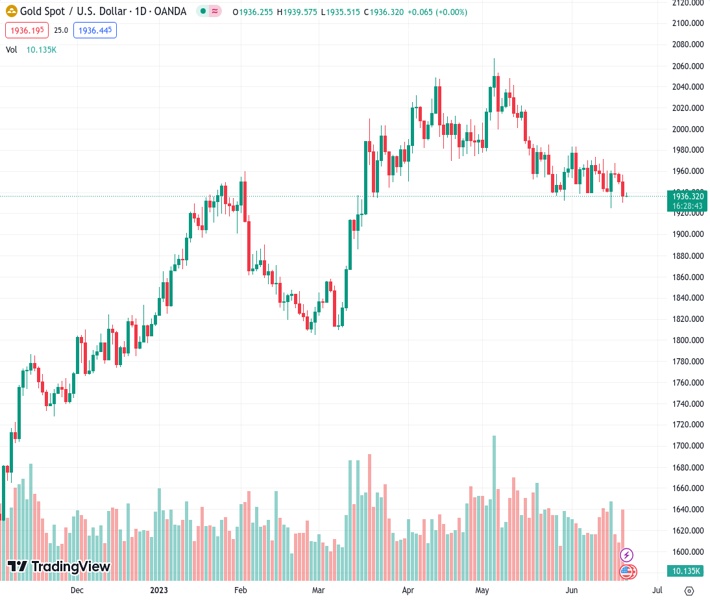
The price of gold, listed as #XAUUSD at 1,936.61, experiences difficulty in achieving significant progress and remains within a narrow range during Wednesday.
…
This is a premium post.
[s2If !current_user_can(access_s2member_level4)]Please register for FREE REGISTER to read full post below containing analysis. In case of any error or you think you are not able to read the full post below, please email us at support#nehcap.com [lwa][/s2If] [s2If current_user_can(access_s2member_level1)]
- Gold price struggles to gain any meaningful traction and oscillates in a range on Wednesday.
The pair currently trades last at 1936.61.
The previous day high was 1956.86 while the previous day low was 1929.82. The daily 38.2% Fib levels comes at 1940.15, expected to provide resistance. Similarly, the daily 61.8% fib level is at 1946.53, expected to provide resistance.
Gold price oscillates in a narrow band through the Asian session on Wednesday and now seems to have found acceptance below a technically significant 100-day Simple Moving Average (SMA). The XAU/USD currently trades just above the $1,935 area and remains well within the striking distance of a three-month low touched last week.
Concerns over rising interest rates turn out to be a key factor that continues to act as a headwind for the non-yielding Gold price. It is worth mentioning that the Reserve Bank of Australia (RBA) and the Bank of Canada (BoC) delivered a surprise 25 bps rate hike earlier this month. Moreover, the European Central Bank (ECB) last week lifted rates to the highest level in 22 years and projected further tightening to bring down inflation. The Bank of England (BoE) and the Swiss National Bank (SNB) are also expected to hike interest rates by 25 bps on Thursday.
Furthermore, the Federal Reserve (Fed) last week forecasted a higher peak interest rate and signalled that borrowing costs may still need to rise as much as 50 bps this year. The expectations were lifted by strong housing market data from the United States (US) on Tuesday, showing that Housing Starts surged to a 13-month high in May. Moreover, permits for future construction also climbed during the reported month, suggesting that the housing market may be turning a corner after taking the biggest hit from the Fed’s fastest monetary policy tightening campaign since the 1980s.
The Fed’s hawkish outlook continues to act as a tailwind for the US Dollar (USD), which is seen as another factor contributing to capping the upside for the Gold price. The USD, however, lacks bullish conviction on the back of rising speculations that the Fed is nearing the end of its year-long rate-hiking cycle. Traders also seem reluctant and prefer to wait on the sidelines ahead of Fed Chair Jerome Powell’s semi-annual congressional testimony, which will be looked for clues about the future rate-hike path. This will help determine the next leg of a directional move for the XAU/USD.
In the meantime, the prevalent cautious mood might continue to lend some support to the safe-haven Gold price and help limit the downside, at least for the time being. The market sentiment remains fragile on the back of growing concerns about a global economic downturn, particularly in China. This, to a larger extent, overshadows an interest rate cut by the People’s Bank of China (PBoC) on Tuesday and continues to dent investors’ appetite for riskier assets. This is evident from the lack of any meaningful buying in the equity markets and drives some haven flows.
From a technical perspective, acceptance below the 100-day SMA could be seen as a fresh trigger for bearish traders and might have already set the stage for further losses. Some follow-through selling below the $1,925-$1,924 zone, or the monthly low, will reaffirm the negative outlook and make the Gold price vulnerable to accelerate the fall towards the $1,900 round figure. The downward trajectory could get extended further towards the $1,876-$1,875 horizontal support before the XAU/USD eventually drops to the very important 200-day SMA, currently around the $1,839 region.
On the flip side, any meaningful recovery beyond the $1,942 zone (100-day SMA) might continue to attract fresh supply and remain capped near the $1,962-$1,964 region. The next relevant hurdle is pegged near the $1,970-$1,972 zone ahead of the $1,983-$1,985 region. A sustained strength beyond the said barriers might trigger a fresh bout of a short-covering move, allowing the Gold price to surpass the $2,000 psychological mark and climb further towards the $2,010-$2,012 resistance.
Technical Levels: Supports and Resistances
XAUUSD currently trading at 1936.08 at the time of writing. Pair opened at 1936.4 and is trading with a change of -0.02 % .
| Overview | Overview.1 | |
|---|---|---|
| 0 | Today last price | 1936.08 |
| 1 | Today Daily Change | -0.32 |
| 2 | Today Daily Change % | -0.02 |
| 3 | Today daily open | 1936.40 |
The pair is trading below its 20 Daily moving average @ 1953.76, below its 50 Daily moving average @ 1983.15 , below its 100 Daily moving average @ 1942.45 and above its 200 Daily moving average @ 1849.86
| Trends | Trends.1 | |
|---|---|---|
| 0 | Daily SMA20 | 1953.76 |
| 1 | Daily SMA50 | 1983.15 |
| 2 | Daily SMA100 | 1942.45 |
| 3 | Daily SMA200 | 1849.86 |
The previous day high was 1956.86 while the previous day low was 1929.82. The daily 38.2% Fib levels comes at 1940.15, expected to provide resistance. Similarly, the daily 61.8% fib level is at 1946.53, expected to provide resistance.
Note the levels of interest below:
- Pivot support is noted at 1925.19, 1913.99, 1898.15
- Pivot resistance is noted at 1952.23, 1968.07, 1979.27
| Levels | Levels.1 |
|---|---|
| Previous Daily High | 1956.86 |
| Previous Daily Low | 1929.82 |
| Previous Weekly High | 1971.01 |
| Previous Weekly Low | 1924.85 |
| Previous Monthly High | 2079.76 |
| Previous Monthly Low | 1932.12 |
| Daily Fibonacci 38.2% | 1940.15 |
| Daily Fibonacci 61.8% | 1946.53 |
| Daily Pivot Point S1 | 1925.19 |
| Daily Pivot Point S2 | 1913.99 |
| Daily Pivot Point S3 | 1898.15 |
| Daily Pivot Point R1 | 1952.23 |
| Daily Pivot Point R2 | 1968.07 |
| Daily Pivot Point R3 | 1979.27 |
[/s2If]
Nehcap Expert Advisor
The NEHCAP MT4 EA is high quality professional trading system geared to generate returns without using GRID or martingales. Each trade has strict risk per trade parameter. The pairs under management include EURUSD, GBPUSD, AUDCAD, AUDNZD,GBPAUD, EURAUD, EURCAD, CHFJPY and many more.
The system is trading live: LIVE ACCOUNT TRACKING
You can run it free. Apply for a free trial and track our account. Buy the system or use profit share mechanism to generate returns on your MT4.
Join Our Telegram Group
")


