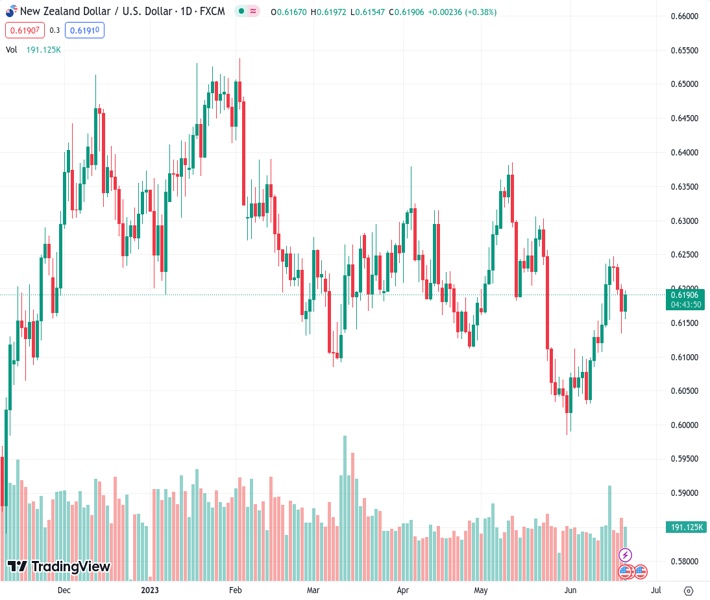
The NZDUSD currency pair reaches a high of approximately 0.6200, then settles at around 0.6160 before bouncing back up to 0.6190.
…
This is a premium post.
[s2If !current_user_can(access_s2member_level4)]Please register for FREE REGISTER to read full post below containing analysis. In case of any error or you think you are not able to read the full post below, please email us at support#nehcap.com [lwa][/s2If] [s2If current_user_can(access_s2member_level1)]
- NZD/USD peaks near 0.6200, then stabilizes around 0.6160 to then recover to 0.6190.
The pair currently trades last at 0.61891.
The previous day high was 0.6215 while the previous day low was 0.6133. The daily 38.2% Fib levels comes at 0.6164, expected to provide support. Similarly, the daily 61.8% fib level is at 0.6184, expected to provide support.
On Wednesday, the NZD/USD faces some volatility jumping to a high of 0.6200 and then stabilizing at 0.6190 as during the mid-American session, Federal Reserve (Fed) Chair Jerome Powell’s hawkish comments helped the USD gain traction. In that sense, a risk-averse market signaled by falling stock indexes and a strong Dollar may limit the Kiwi’s gains.
In his testimony before the US Congress, Jerome Powell, Chair of the Federal Reserve (Fed), commented that, “nearly all FOMC participants expect it will be appropriate to raise interest rates somewhat further by year-end” and that, “reducing inflation is likely to require a period of below-trend growth, some softening of labor market conditions.” In that sense the expectations of more hikes combined with the “cost” of reducing inflation worsened the market’s mood and gave the US Dollar traction.
In response, the US bond yields are seeing gains across the curve. The 10-year bond yield has risen to 3.77%, while the 2-year yield stands at 4.74% and the 5-year yields 4.01%, respectively. Elsewhere, on Wall Street, stock markets weaken, as all three major indices fall into negative territory. The S&P 500 index, also known as SPX, has experienced a slight decline of 0.42%. Similarly, the Dow Jones Industrial Average, or DJI, has seen a modest drop of 0.45%, while the Nasdaq Composite (NDX), has recorded a decrease of 0.34%.
The focus now shifts to US Jobless Claims from the second week of June, to be released on Thursday and the S&P manufacturing PMI from the month of June on Friday, where investors will get additional information regarding the US economy and continue modeling their expectations towards the next Fed meeting in July.
According to the daily chart, the technical outlook for the NZD/USD is neutral to bearish for the short term as despite clinging into slight daily gains, indicators have lost ground and are showing a deceleration of the bullish momentum. If the bulls want to reignite their momentum, they should defend the 200-day Simple Moving Average (SMA) at 0.6156.
On the downside, support levels line up at the mentioned 200-day SMA, followed by the 20-day SMA at 0.6108, and the 0.6100 psychological mark. On the upside, in case the bulls regain traction, the 100-day SMA at 0.6210 is the first resistance to retake, which could pave the way towards 0.6235 and the monthly high at 0.6245.
Technical Levels: Supports and Resistances
NZDUSD currently trading at 0.6187 at the time of writing. Pair opened at 0.6167 and is trading with a change of 0.32 % .
| Overview | Overview.1 | |
|---|---|---|
| 0 | Today last price | 0.6187 |
| 1 | Today Daily Change | 0.0020 |
| 2 | Today Daily Change % | 0.3200 |
| 3 | Today daily open | 0.6167 |
The pair is trading above its 20 Daily moving average @ 0.611, above its 50 Daily moving average @ 0.6177 , below its 100 Daily moving average @ 0.6213 and above its 200 Daily moving average @ 0.6153
| Trends | Trends.1 | |
|---|---|---|
| 0 | Daily SMA20 | 0.6110 |
| 1 | Daily SMA50 | 0.6177 |
| 2 | Daily SMA100 | 0.6213 |
| 3 | Daily SMA200 | 0.6153 |
The previous day high was 0.6215 while the previous day low was 0.6133. The daily 38.2% Fib levels comes at 0.6164, expected to provide support. Similarly, the daily 61.8% fib level is at 0.6184, expected to provide support.
Note the levels of interest below:
- Pivot support is noted at 0.6129, 0.609, 0.6047
- Pivot resistance is noted at 0.621, 0.6254, 0.6292
| Levels | Levels.1 |
|---|---|
| Previous Daily High | 0.6215 |
| Previous Daily Low | 0.6133 |
| Previous Weekly High | 0.6250 |
| Previous Weekly Low | 0.6076 |
| Previous Monthly High | 0.6385 |
| Previous Monthly Low | 0.5985 |
| Daily Fibonacci 38.2% | 0.6164 |
| Daily Fibonacci 61.8% | 0.6184 |
| Daily Pivot Point S1 | 0.6129 |
| Daily Pivot Point S2 | 0.6090 |
| Daily Pivot Point S3 | 0.6047 |
| Daily Pivot Point R1 | 0.6210 |
| Daily Pivot Point R2 | 0.6254 |
| Daily Pivot Point R3 | 0.6292 |
[/s2If]
Nehcap Expert Advisor
The NEHCAP MT4 EA is high quality professional trading system geared to generate returns without using GRID or martingales. Each trade has strict risk per trade parameter. The pairs under management include EURUSD, GBPUSD, AUDCAD, AUDNZD,GBPAUD, EURAUD, EURCAD, CHFJPY and many more.
The system is trading live: LIVE ACCOUNT TRACKING
You can run it free. Apply for a free trial and track our account. Buy the system or use profit share mechanism to generate returns on your MT4.
Join Our Telegram Group
")


