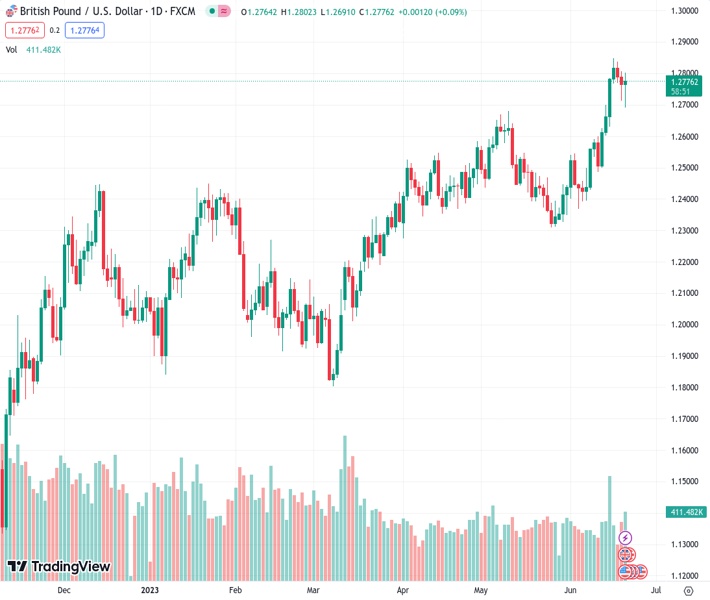
The GBPUSD exchange rate of 1.27751 increases after the release of UK inflation data and as the US Dollar becomes less strong.
…
This is a premium post.
[s2If !current_user_can(access_s2member_level4)]Please register for FREE REGISTER to read full post below containing analysis. In case of any error or you think you are not able to read the full post below, please email us at support#nehcap.com [lwa][/s2If] [s2If current_user_can(access_s2member_level1)]
- GBP/USD recovers following UK inflation data release as the US Dollar weakens.
The pair currently trades last at 1.27751.
The previous day high was 1.2807 while the previous day low was 1.2714. The daily 38.2% Fib levels comes at 1.2749, expected to provide support. Similarly, the daily 61.8% fib level is at 1.2771, expected to provide support.
GBP/USD recovered some ground following the release of inflation data in the United Kingdom (UK), which initially underpinned the GBP/USD. Nevertheless, it reversed its gains, as investors doubted the Bank of England (BoE) could tame inflation without damaging the economy. The GBP/USD trades at 1.2773, above its opening price after hitting a daily low of 1.2689.
A risk-off impulse keeps Wall Street pressured as the Federal Reserve Chairman Jerome Powell commenced its two-day testimony in the US Congress. Powell commented that the US central bank would continue to raise rates, despite reducing growth, to contain stubbornly high inflation.
Moreover, Jerome Powell added that the decisions would be taken meeting-by-meeting based on incoming data and that “it may make sense to move rates higher, at a moderate pace.”
GBP/USD traders should be aware of last week’s Fed’s decision to keep rates unchanged at 5.00%-5.25%. However, officials upward revised peak rates above the 5.50% threshold, which seems to be seen as too high according to CME FedWatch Tool data. Odds for a 25 bps Fed rate hike at the July meeting are 74.4%, but investors are not foreseeing rates past the 5.25%-5.50% range.
Meanwhile, UK consumer inflation data rose by 8.7% YoY in May, unchanged from April’s data, though exceeded estimates of 8.4%. Core inflation, which excludes volatile items, expanded by 7.1% YoY, above forecasts of 6.8%, putting pressure on the Bank of England (BoE) to take measures to curb inflation.
On Thursday, the BoE is expected to raise rates by 25 bps to 4.75%. However, the latest round of inflation data augmented expectations the BoE could raise rates by 50 bps, as money markets odds lie at a 50% chance of a half-point rise.
The UK will feature the BoE’s decision. The US economic agenda will feature the Current Account, the Chicago Fed National Activity Index, and Initial Jobless Claims. Also, the Fed Chair Jerome Powell will continue its two-day testimony before the US Congress, while some officials would cross newswires.
The GBP/USD remains upward biased, as Wednesday’s price action is forming a hammer preceded by a two-day downtrend. If GBP/USD clears the 1.2800 figure, buyers could threaten to cling to 1.2900, but first, they will need to crack the year-to-date (YTD) high at 1.2848. If the BoE surprises with a hawkish hike, the GBP/USD could be poised to test 1.3000. Conversely, sellers need a daily close below 1.2764 if they would like to drag prices toward 1.2600, but they need to surpass the 20-day EMA at 1.2611.
Technical Levels: Supports and Resistances
GBPUSD currently trading at 1.2775 at the time of writing. Pair opened at 1.2765 and is trading with a change of 0.08 % .
| Overview | Overview.1 | |
|---|---|---|
| 0 | Today last price | 1.2775 |
| 1 | Today Daily Change | 0.0010 |
| 2 | Today Daily Change % | 0.0800 |
| 3 | Today daily open | 1.2765 |
The pair remains strongly bullish on the daily timeframe. It trades above its 20 SMA @ 1.253, 50 SMA 1.2507, 100 SMA @ 1.2333 and 200 SMA @ 1.2057.
| Trends | Trends.1 | |
|---|---|---|
| 0 | Daily SMA20 | 1.2530 |
| 1 | Daily SMA50 | 1.2507 |
| 2 | Daily SMA100 | 1.2333 |
| 3 | Daily SMA200 | 1.2057 |
The previous day high was 1.2807 while the previous day low was 1.2714. The daily 38.2% Fib levels comes at 1.2749, expected to provide support. Similarly, the daily 61.8% fib level is at 1.2771, expected to provide support.
Note the levels of interest below:
- Pivot support is noted at 1.2717, 1.2669, 1.2624
- Pivot resistance is noted at 1.281, 1.2855, 1.2903
| Levels | Levels.1 |
|---|---|
| Previous Daily High | 1.2807 |
| Previous Daily Low | 1.2714 |
| Previous Weekly High | 1.2848 |
| Previous Weekly Low | 1.2487 |
| Previous Monthly High | 1.2680 |
| Previous Monthly Low | 1.2308 |
| Daily Fibonacci 38.2% | 1.2749 |
| Daily Fibonacci 61.8% | 1.2771 |
| Daily Pivot Point S1 | 1.2717 |
| Daily Pivot Point S2 | 1.2669 |
| Daily Pivot Point S3 | 1.2624 |
| Daily Pivot Point R1 | 1.2810 |
| Daily Pivot Point R2 | 1.2855 |
| Daily Pivot Point R3 | 1.2903 |
[/s2If]
Nehcap Expert Advisor
The NEHCAP MT4 EA is high quality professional trading system geared to generate returns without using GRID or martingales. Each trade has strict risk per trade parameter. The pairs under management include EURUSD, GBPUSD, AUDCAD, AUDNZD,GBPAUD, EURAUD, EURCAD, CHFJPY and many more.
The system is trading live: LIVE ACCOUNT TRACKING
You can run it free. Apply for a free trial and track our account. Buy the system or use profit share mechanism to generate returns on your MT4.
Join Our Telegram Group
")


