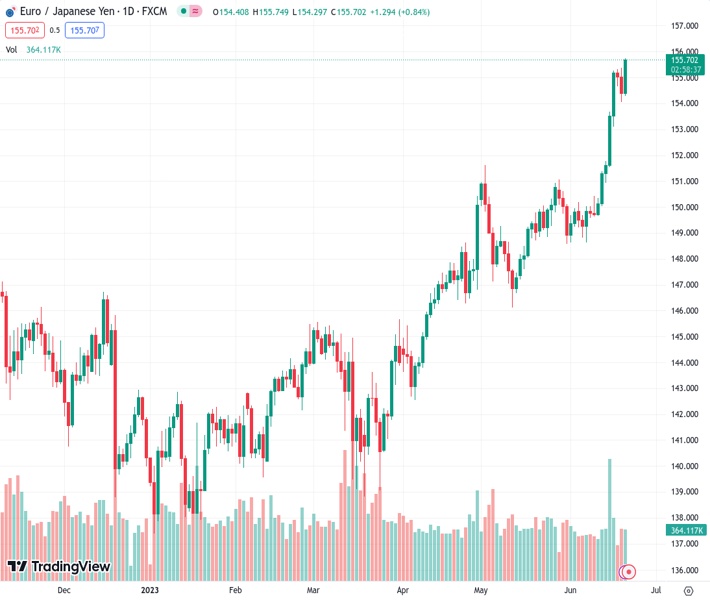
The EURJPY surged past the 155.50 area and reached a new peak of 155.75 in its current cycle.
…
This is a premium post.
[s2If !current_user_can(access_s2member_level4)]Please register for FREE REGISTER to read full post below containing analysis. In case of any error or you think you are not able to read the full post below, please email us at support#nehcap.com [lwa][/s2If] [s2If current_user_can(access_s2member_level1)]
- EUR/JPY soared above the 155.50 zone, hitting a fresh cycle high of 155.75.
The pair currently trades last at 155.712.
The previous day high was 155.38 while the previous day low was 154.05. The daily 38.2% Fib levels comes at 154.56, expected to provide support. Similarly, the daily 61.8% fib level is at 154.87, expected to provide support.
The EUR/JPY is gaining ground on Wednesday following comments from European Central Bank’s (ECB) speakers which fueled a rise in German bond yields making the Euro gain appeal. On the other hand, the JPY seems to be losing interest after dovish clues seen in Bank of Japan’s (BoJ) April meeting minutes. All eyes are now on Friday inflation data for May.
On Wednesday, ECB’s Isabel Schnabel stated that they should be “stubborn” because inflation remains “stubborn”, while Joachim Nagel claimed that he is confident that inflation will come back to target but that “there is still way to go”. As a reaction, the German yields are seeing gains across the curve. The 10-year bond yield rose to 2.41%, while the 2-year yield stands at 3.19% and the 5-year yields 2.56%, respectively. In that sense, as higher domestic yields attract foreign capital, the Euro strengthens.
As for now, according to WIRP (World Interest Rate Possibilities), markets are expecting a 25 basis point (bps) hike at the next ECB July meeting. Additionally, the market bet on a 60% probability of another 25 bp rate hike in September, which is expected to increase to around 90% probability in the fourth quarter. If this rate trajectory materializes, the maximum deposit rate will reach 4.0%.
On the other hand, following the release of the dovish minutes from April’s BoJ meeting, all eyes are set on Friday inflation figures from Japan. The Consumer Price Index (CPI) is expected to rise to 4.1% (YoY) vs. the previous 3.5%, while the Core inflation rate, which excludes the influence of oil and food prices, is projected to rise to 4.4% from the previous release of 4.1%.
Technically speaking, the EUR/JPY maintains a bullish outlook for the short term, as per indicators on the daily chart. The Relative Strength Index (RSI) and Moving Average Convergence Divergence (MACD) are both pointing north and the pair trades above its main moving averages, suggesting that the buyers have the upper hand. However, indicators show overbought conditions suggesting that the cross may still be poised for another downward correction.
A move above the 155.75 area (daily high) would suggest a continuation of the bullish trend for EUR/JPY, with next resistances at the psychological mark at 156.00 and 156.50 area. On the other hand, immediate support for the cross is seen at the 155.50 zone level, followed by the psychological mark at 154.00 and the 153.50 zone.
Technical Levels: Supports and Resistances
EURJPY currently trading at 155.64 at the time of writing. Pair opened at 154.44 and is trading with a change of 0.78 % .
| Overview | Overview.1 | |
|---|---|---|
| 0 | Today last price | 155.64 |
| 1 | Today Daily Change | 1.20 |
| 2 | Today Daily Change % | 0.78 |
| 3 | Today daily open | 154.44 |
The pair remains strongly bullish on the daily timeframe. It trades above its 20 SMA @ 150.97, 50 SMA 149.28, 100 SMA @ 146.16 and 200 SMA @ 144.6.
| Trends | Trends.1 | |
|---|---|---|
| 0 | Daily SMA20 | 150.97 |
| 1 | Daily SMA50 | 149.28 |
| 2 | Daily SMA100 | 146.16 |
| 3 | Daily SMA200 | 144.60 |
The previous day high was 155.38 while the previous day low was 154.05. The daily 38.2% Fib levels comes at 154.56, expected to provide support. Similarly, the daily 61.8% fib level is at 154.87, expected to provide support.
Note the levels of interest below:
- Pivot support is noted at 153.87, 153.29, 152.54
- Pivot resistance is noted at 155.2, 155.96, 156.53
| Levels | Levels.1 |
|---|---|
| Previous Daily High | 155.38 |
| Previous Daily Low | 154.05 |
| Previous Weekly High | 155.27 |
| Previous Weekly Low | 149.67 |
| Previous Monthly High | 151.62 |
| Previous Monthly Low | 146.14 |
| Daily Fibonacci 38.2% | 154.56 |
| Daily Fibonacci 61.8% | 154.87 |
| Daily Pivot Point S1 | 153.87 |
| Daily Pivot Point S2 | 153.29 |
| Daily Pivot Point S3 | 152.54 |
| Daily Pivot Point R1 | 155.20 |
| Daily Pivot Point R2 | 155.96 |
| Daily Pivot Point R3 | 156.53 |
[/s2If]
Nehcap Expert Advisor
The NEHCAP MT4 EA is high quality professional trading system geared to generate returns without using GRID or martingales. Each trade has strict risk per trade parameter. The pairs under management include EURUSD, GBPUSD, AUDCAD, AUDNZD,GBPAUD, EURAUD, EURCAD, CHFJPY and many more.
The system is trading live: LIVE ACCOUNT TRACKING
You can run it free. Apply for a free trial and track our account. Buy the system or use profit share mechanism to generate returns on your MT4.
Join Our Telegram Group
")


