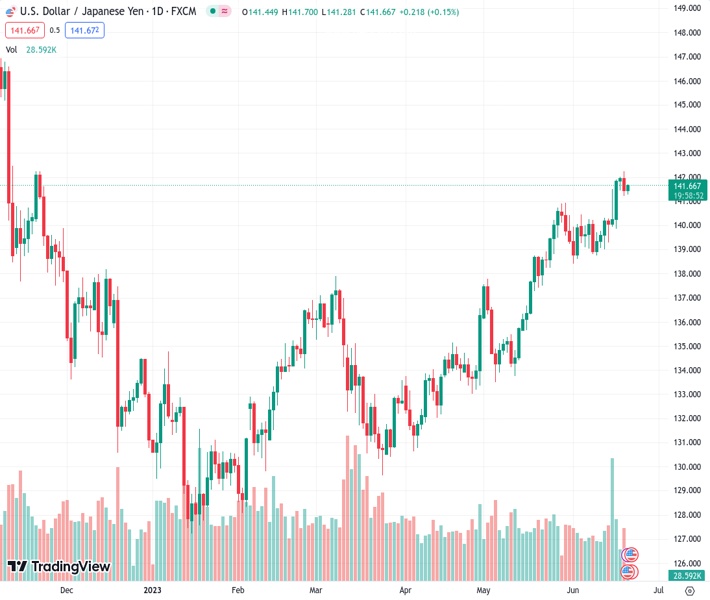
The currency pair of USDJPY has reached a support level close to the 100-hour simple moving average at 141.636, which has prevented it from continuing its downward trend from the year-to-date peak during the previous night.
…
This is a premium post.
[s2If !current_user_can(access_s2member_level4)]Please register for FREE REGISTER to read full post below containing analysis. In case of any error or you think you are not able to read the full post below, please email us at support#nehcap.com [lwa][/s2If] [s2If current_user_can(access_s2member_level1)]
- USD/JPY finds support near 100-hour SMA and stalls the overnight slide from the YTD top.
The pair currently trades last at 141.636.
The previous day high was 142.25 while the previous day low was 141.21. The daily 38.2% Fib levels comes at 141.61, expected to provide support. Similarly, the daily 61.8% fib level is at 141.86, expected to provide resistance.
The USD/JPY pair struggles to gain any meaningful traction on Wednesday and oscillates in a narrow trading band, just above the mid-141.00s through the Asian session. Spot prices, however, manage to hold above the 100-hour Simple Moving Average (SMA) and for now, seem to have stalled the previous day’s pullback from the highest level since November 2022.
The Japanese Yen (JPY) continues to be undermined by a more dovish stance adopted by the Bank of Japan (BoJ), which, in turn, acts as a tailwind for the USD/JPY pair. In fact, the minutes of the April BoJ meeting showed that several members said it was appropriate for the central bank to continue with the current monetary easing. The minutes also revealed that Japanese Prime Minister (PM) Fumio Kishida and BoJ Governor Kazuo Ueda agreed that at this point, there was no need to change the joint statement between the government and BoJ.
Apart from this, a modest US Dollar (USD) uptick turns out to be another factor lending some support to the USD/JPY pair. The Federal Reserve’s (Fed) hawkish outlook, signalling that borrowing costs may still need to rise as much as 50 bps and forecasting a higher peak interest rate this year, remains supportive of a mild bid tone surrounding the buck. The USD bulls, however, seem reluctant to place aggressive bets ahead of Fed Chair Jerome Powell’s testimony, against the backdrop of expectations that the US central bank is nearing the end of its rate-hiking cycle.
Hence, Powell’s comments will be closely scrutinized for clues about the Fed’s future rate-hike path, which, along with scheduled speeches by a slew of FOMC members, will play a key role in influencing the USD price dynamics. This, in turn, should help investors to determine the near-term trajectory for the USD/JPY pair. Nevertheless, the aforementioned fundamental backdrop suggests that the path of least resistance for spot prices is to the upside and any meaningful corrective decline might still be seen as a buying opportunity, rather remain limited.
Technical Levels: Supports and Resistances
USDJPY currently trading at 141.54 at the time of writing. Pair opened at 141.49 and is trading with a change of 0.04 % .
| Overview | Overview.1 | |
|---|---|---|
| 0 | Today last price | 141.54 |
| 1 | Today Daily Change | 0.05 |
| 2 | Today Daily Change % | 0.04 |
| 3 | Today daily open | 141.49 |
The pair remains strongly bullish on the daily timeframe. It trades above its 20 SMA @ 140.09, 50 SMA 137.23, 100 SMA @ 135.24 and 200 SMA @ 137.22.
| Trends | Trends.1 | |
|---|---|---|
| 0 | Daily SMA20 | 140.09 |
| 1 | Daily SMA50 | 137.23 |
| 2 | Daily SMA100 | 135.24 |
| 3 | Daily SMA200 | 137.22 |
The previous day high was 142.25 while the previous day low was 141.21. The daily 38.2% Fib levels comes at 141.61, expected to provide support. Similarly, the daily 61.8% fib level is at 141.86, expected to provide resistance.
Note the levels of interest below:
- Pivot support is noted at 141.05, 140.61, 140.01
- Pivot resistance is noted at 142.09, 142.69, 143.13
| Levels | Levels.1 |
|---|---|
| Previous Daily High | 142.25 |
| Previous Daily Low | 141.21 |
| Previous Weekly High | 141.92 |
| Previous Weekly Low | 139.01 |
| Previous Monthly High | 140.93 |
| Previous Monthly Low | 133.50 |
| Daily Fibonacci 38.2% | 141.61 |
| Daily Fibonacci 61.8% | 141.86 |
| Daily Pivot Point S1 | 141.05 |
| Daily Pivot Point S2 | 140.61 |
| Daily Pivot Point S3 | 140.01 |
| Daily Pivot Point R1 | 142.09 |
| Daily Pivot Point R2 | 142.69 |
| Daily Pivot Point R3 | 143.13 |
[/s2If]
Nehcap Expert Advisor
The NEHCAP MT4 EA is high quality professional trading system geared to generate returns without using GRID or martingales. Each trade has strict risk per trade parameter. The pairs under management include EURUSD, GBPUSD, AUDCAD, AUDNZD,GBPAUD, EURAUD, EURCAD, CHFJPY and many more.
The system is trading live: LIVE ACCOUNT TRACKING
You can run it free. Apply for a free trial and track our account. Buy the system or use profit share mechanism to generate returns on your MT4.
Join Our Telegram Group
")


