During the early European session, NZDUSD fluctuated between small increases and slight reductions. Its value stood at 0.61578.
…
This is a premium post.
[s2If !current_user_can(access_s2member_level4)]Please register for FREE REGISTER to read full post below containing analysis. In case of any error or you think you are not able to read the full post below, please email us at support#nehcap.com [lwa][/s2If] [s2If current_user_can(access_s2member_level1)]
- NZD/USD seesaws between tepid gains/minor losses through the early European session.
The pair currently trades last at 0.61578.
The previous day high was 0.6215 while the previous day low was 0.6133. The daily 38.2% Fib levels comes at 0.6164, expected to provide resistance. Similarly, the daily 61.8% fib level is at 0.6184, expected to provide resistance.
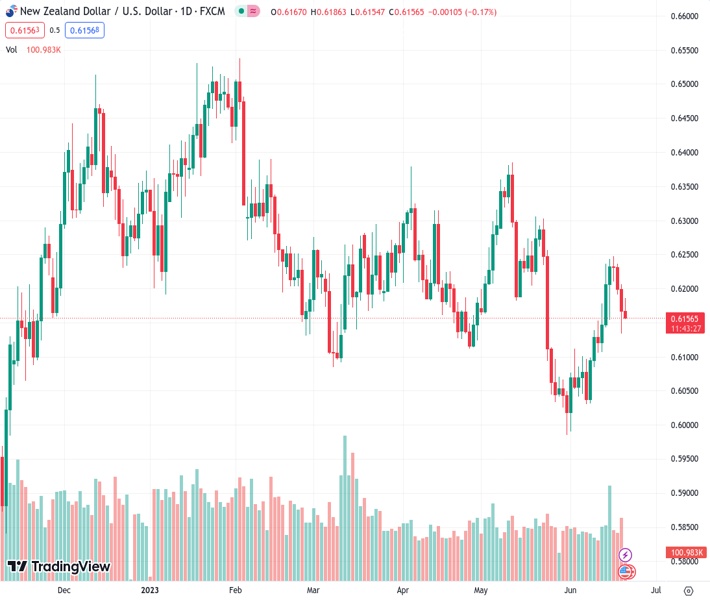
The NZD/USD pair struggles to capitalize on its modest intraday gains and seesaws between tepid gains/minor losses through the first half of the European session on Wednesday. Spot prices currently trade around the 0.6165 region, nearly unchanged for the day, and remain well within the striking distance of a one-week low touched on Tuesday.
The Federal Reserve’s (Fed) hawkish outlook, signalling that borrowing costs may still need to rise as much as 50 bps this year, acts as a tailwind for the US Dollar (USD), which, in turn, is seen as capping the upside for the NZD/USD pair. Apart from this, worries about a global economic slowdown further benefits the Greenback’s safe-haven status and undermines the risk-sensitive Kiwi. The downside, however, remains cushioned, at least for the time being, as traders keenly await the Fed Chair Jerome Powell’s semi-annual congressional testimony before placing fresh directional bets.
From a technical perspective, the NZD/USD pair on Tuesday found some support near the 38.2% Fibonacci retracement level of the downfall witnessed in May. The subsequent recovery, however, falters near 50% Fibo. level. This, along with the recent failure to find acceptance above a confluence comprising the 200-day Exponential Moving Average (EMA) and the 61.8% Fibo. level favours bearish traders. That said, neutral oscillators on the daily chart make it prudent to wait for some follow-through selling below the overnight swing low, around the 0.6135 region, before placing fresh bearish bets.
The NZD/USD pair might then turn vulnerable to weaken further below the 0.6100 round-figure mark and test the 23.6% Fibo. level, around the 0.6080-0.6075 region. Failure to defend the said support levels will expose the YTD low – levels just below the 0.6000 psychological mark – touched on May 31. Spot prices could extend the downward trajectory further towards testing the next relevant support near the 0.5945-0.5940 zone.
On the flip side, the daily swing high, around the 0.6185 region, which coincides with the 50% Fibo. level, now seems to act as an immediate hurdle ahead of the 0.6200 mark. Any subsequent move up might continue to confront stiff resistance and remain capped near the 0.6230 confluence. That said, a sustained strength beyond the 0.6245-0.6250 area, or the monthly top touched last week, will negate the bearish bias and pave the way for some meaningful upside for the NZD/USD pair.
Technical Levels: Supports and Resistances
NZDUSD currently trading at 0.6163 at the time of writing. Pair opened at 0.6167 and is trading with a change of -0.06 % .
| Overview | Overview.1 | |
|---|---|---|
| 0 | Today last price | 0.6163 |
| 1 | Today Daily Change | -0.0004 |
| 2 | Today Daily Change % | -0.0600 |
| 3 | Today daily open | 0.6167 |
The pair is trading above its 20 Daily moving average @ 0.611, below its 50 Daily moving average @ 0.6177 , below its 100 Daily moving average @ 0.6213 and above its 200 Daily moving average @ 0.6153
| Trends | Trends.1 | |
|---|---|---|
| 0 | Daily SMA20 | 0.6110 |
| 1 | Daily SMA50 | 0.6177 |
| 2 | Daily SMA100 | 0.6213 |
| 3 | Daily SMA200 | 0.6153 |
The previous day high was 0.6215 while the previous day low was 0.6133. The daily 38.2% Fib levels comes at 0.6164, expected to provide resistance. Similarly, the daily 61.8% fib level is at 0.6184, expected to provide resistance.
Note the levels of interest below:
- Pivot support is noted at 0.6129, 0.609, 0.6047
- Pivot resistance is noted at 0.621, 0.6254, 0.6292
| Levels | Levels.1 |
|---|---|
| Previous Daily High | 0.6215 |
| Previous Daily Low | 0.6133 |
| Previous Weekly High | 0.6250 |
| Previous Weekly Low | 0.6076 |
| Previous Monthly High | 0.6385 |
| Previous Monthly Low | 0.5985 |
| Daily Fibonacci 38.2% | 0.6164 |
| Daily Fibonacci 61.8% | 0.6184 |
| Daily Pivot Point S1 | 0.6129 |
| Daily Pivot Point S2 | 0.6090 |
| Daily Pivot Point S3 | 0.6047 |
| Daily Pivot Point R1 | 0.6210 |
| Daily Pivot Point R2 | 0.6254 |
| Daily Pivot Point R3 | 0.6292 |
[/s2If]
Nehcap Expert Advisor
The NEHCAP MT4 EA is high quality professional trading system geared to generate returns without using GRID or martingales. Each trade has strict risk per trade parameter. The pairs under management include EURUSD, GBPUSD, AUDCAD, AUDNZD,GBPAUD, EURAUD, EURCAD, CHFJPY and many more.
The system is trading live: LIVE ACCOUNT TRACKING
You can run it free. Apply for a free trial and track our account. Buy the system or use profit share mechanism to generate returns on your MT4.
Join Our Telegram Group
")


