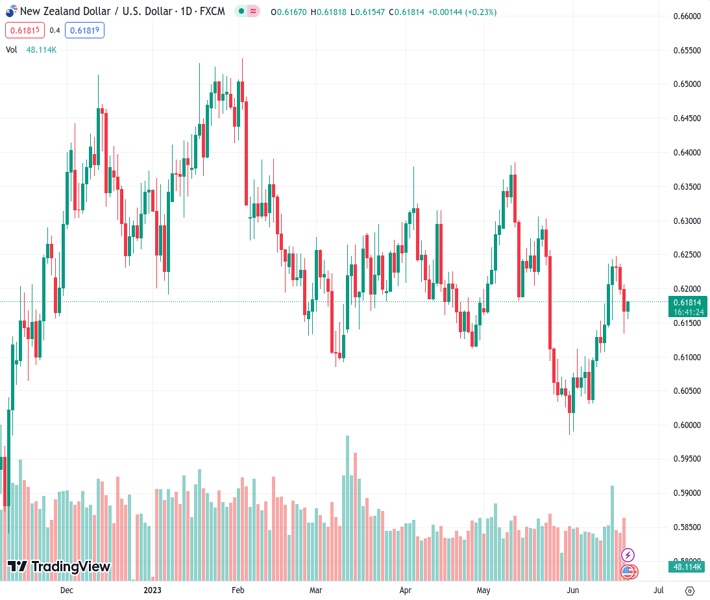
During the Asian session on Wednesday, the NZDUSD pair stayed restricted within a small range of trading around the level of 0.61780.
…
This is a premium post.
[s2If !current_user_can(access_s2member_level4)]Please register for FREE REGISTER to read full post below containing analysis. In case of any error or you think you are not able to read the full post below, please email us at support#nehcap.com [lwa][/s2If] [s2If current_user_can(access_s2member_level1)]
- NZD/USD remains confined in a narrow trading band through the Asian session on Wednesday.
The pair currently trades last at 0.61780.
The previous day high was 0.6215 while the previous day low was 0.6133. The daily 38.2% Fib levels comes at 0.6164, expected to provide support. Similarly, the daily 61.8% fib level is at 0.6184, expected to provide resistance.
The NZD/USD pair struggles to capitalize on the overnight bounce from the 0.6135-0.6130 area or a one-week low and oscillates in a narrow band through the Asian session on Wednesday. Spot prices currently trade around the 0.6165-0.6170 region, nearly unchanged for the day, with bulls awaiting sustained strength beyond the 200-hour Simple Moving Average (SMA) before positioning for any meaningful intraday appreciating move.
The US Dollar (USD) attracts some dip-buying following the previous day’s modest pullback from the 50-day SMA and is seen as a key factor acting as a headwind for the NZD/USD pair. The Federal Reserve (Fed) last week signalled that borrowing costs may still need to rise as much as 50 bps by the end of this year and continues to lend some support to the Greenback. Apart from this, worries about a global economic downturn, particularly in China, further benefit the safe-haven buck and contribute to capping the upside for the risk-sensitive Kiwi.
Investors, however, seem convinced that the US central bank is nearing the end of its year-long policy tightening cycle. This had led to the recent decline in the US Treasury bond yields, which is capping gains for the USD and helping limit the downside for the NZD/USD pair, at least for the time being. Traders also seem reluctant to place aggressive bets and now seem to have moved to the sidelines, awaiting Fed Chair Jerome Powell’s two-day semi-annual congressional testimony, starting this Wednesday, before positioning for the next leg of a directional move.
Market participants will closely scrutinize Powell’s comments for fresh clues about the Fed’s future rate-hike path. This, along with speeches by a slew of influential FOMC members, will play a key role in driving the USD demand and provide some impetus to the NZD/USD pair later during the early North American session. That said, the Reserve Bank of New Zealand’s (RBNZ) explicit signal that it was done with its most aggressive hiking cycle since 1999 favours bearish traders and suggests that the path of least resistance for spot prices is to the downside.
Technical Levels: Supports and Resistances
NZDUSD currently trading at 0.6167 at the time of writing. Pair opened at 0.6167 and is trading with a change of 0.0 % .
| Overview | Overview.1 | |
|---|---|---|
| 0 | Today last price | 0.6167 |
| 1 | Today Daily Change | 0.0000 |
| 2 | Today Daily Change % | 0.0000 |
| 3 | Today daily open | 0.6167 |
The pair is trading above its 20 Daily moving average @ 0.611, below its 50 Daily moving average @ 0.6177 , below its 100 Daily moving average @ 0.6213 and above its 200 Daily moving average @ 0.6153
| Trends | Trends.1 | |
|---|---|---|
| 0 | Daily SMA20 | 0.6110 |
| 1 | Daily SMA50 | 0.6177 |
| 2 | Daily SMA100 | 0.6213 |
| 3 | Daily SMA200 | 0.6153 |
The previous day high was 0.6215 while the previous day low was 0.6133. The daily 38.2% Fib levels comes at 0.6164, expected to provide support. Similarly, the daily 61.8% fib level is at 0.6184, expected to provide resistance.
Note the levels of interest below:
- Pivot support is noted at 0.6129, 0.609, 0.6047
- Pivot resistance is noted at 0.621, 0.6254, 0.6292
| Levels | Levels.1 |
|---|---|
| Previous Daily High | 0.6215 |
| Previous Daily Low | 0.6133 |
| Previous Weekly High | 0.6250 |
| Previous Weekly Low | 0.6076 |
| Previous Monthly High | 0.6385 |
| Previous Monthly Low | 0.5985 |
| Daily Fibonacci 38.2% | 0.6164 |
| Daily Fibonacci 61.8% | 0.6184 |
| Daily Pivot Point S1 | 0.6129 |
| Daily Pivot Point S2 | 0.6090 |
| Daily Pivot Point S3 | 0.6047 |
| Daily Pivot Point R1 | 0.6210 |
| Daily Pivot Point R2 | 0.6254 |
| Daily Pivot Point R3 | 0.6292 |
[/s2If]
Nehcap Expert Advisor
The NEHCAP MT4 EA is high quality professional trading system geared to generate returns without using GRID or martingales. Each trade has strict risk per trade parameter. The pairs under management include EURUSD, GBPUSD, AUDCAD, AUDNZD,GBPAUD, EURAUD, EURCAD, CHFJPY and many more.
The system is trading live: LIVE ACCOUNT TRACKING
You can run it free. Apply for a free trial and track our account. Buy the system or use profit share mechanism to generate returns on your MT4.
Join Our Telegram Group
")


