Despite hawkish remarks from Federal Reserve Chair Jerome Powell, the Mexican Peso (MXN) has gained ground against the US Dollar (USD), with the exchange rate at #USDMXN @ 17.1268.
…
This is a premium post.
[s2If !current_user_can(access_s2member_level4)]Please register for FREE REGISTER to read full post below containing analysis. In case of any error or you think you are not able to read the full post below, please email us at support#nehcap.com [lwa][/s2If] [s2If current_user_can(access_s2member_level1)]
- Mexican Peso (MXN) advances against the US Dollar (USD) despite hawkish comments from Federal Reserve Chair Jerome Powell.
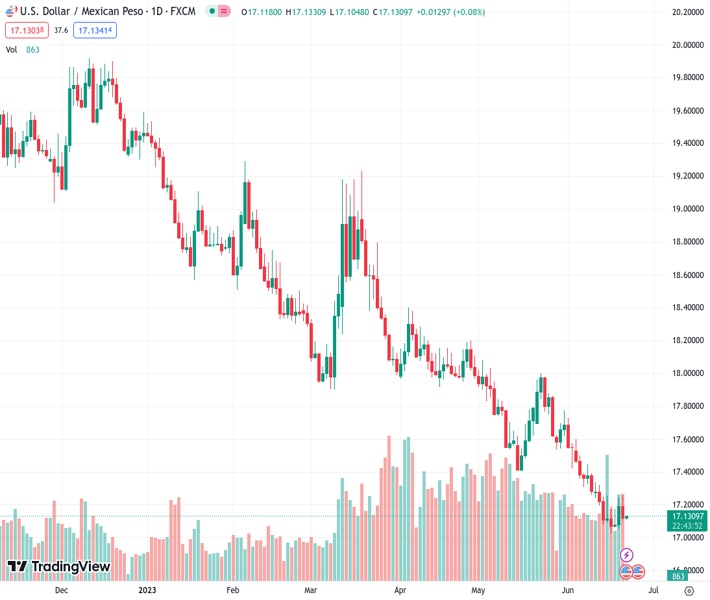
The pair currently trades last at 17.1268.
The previous day high was 17.2428 while the previous day low was 17.071. The daily 38.2% Fib levels comes at 17.1772, expected to provide resistance. Similarly, the daily 61.8% fib level is at 17.1367, expected to provide resistance.
The Mexican Peso (MXN) recovered territory vs. the US Dollar(USD) despite hawkish comments by the Federal Reserve (Fed) Chair Jerome Powell in its first-day appearance before the US Congress. The emerging market currency advanced, underpinned by high oil prices, while market participants looked towards the Bank of Mexico (Banxico) monetary policy decision on Thursday. The USD/MXN is trading at 17.0990, down 0.08%.
Wall Street finished with losses, as Jerome Powell delivered some hawkish remarks, emphasizing the US central bank would hike 25 bps at least two more times as he answered US House Representatives’ questions. Even though Fed members upward revised peak rates toward 5.6%, traders foresee just one 25 bps rate increase in July, as shown by the CME Fed WatchTool, with odds at 72%.
Meanwhile, Fed officials’ opinions began to diverge. Chicago and Atlanta Fed Presidents Goolsbee and Bostic adopted a dovish stance, with the former suggesting the US central bank is in wait-and-see mode, contrary to last Friday’s opinions, opening with Waller and Barkin, welcoming additional tightening.
The USD/MXN extended its losses as the greenback trended lower. The US Dollar Index, which measures the buck’s value against a basket of currencies, stumbles 0.44%, down at 102.088.
On Thursday, Banxico is expected to hold rates for the second meeting in a row after raising rates by more than 700 bps as inflation cools down, as shown by the latest inflation report, with CPI expanding at 5.84%, below analysts’ estimates of 5.90%.
Comments made by Banxico’s officials suggested the central bank will keep rates unchanged, remaining higher for longer. But the first rate cut is expected towards the fourth quarter, as said by Goldman Sachs analysts.
The USD/MXN remains downward biased, with Tuesday’s gains being cut at half by Wednesday’s losses. The strength of the downtrend makes it challenging to project the USD/MXN pair direction. If Banxico keeps rates unchanged with a neutral tone, the USD/MXN could aim toward the 20-day Exponential Moving Average (EMA) at 17.3148, but overall positioning suggests a continuation of the downtrend. A rate hike would see the USD/MXN breaking support at 17.0000 and the pair diving toward October 2015 low of 16.3267.
Technical Levels: Supports and Resistances
USDMXN currently trading at 17.128 at the time of writing. Pair opened at 17.215 and is trading with a change of -0.51 % .
| Overview | Overview.1 | |
|---|---|---|
| 0 | Today last price | 17.128 |
| 1 | Today Daily Change | -0.087 |
| 2 | Today Daily Change % | -0.510 |
| 3 | Today daily open | 17.215 |
The pair remains strongly bearish on the daily time frame. It trades below the 20 SMA @ 17.4155, 50 SMA 17.69, 100 SMA @ 18.0671 and 200 SMA @ 18.8189.
| Trends | Trends.1 | |
|---|---|---|
| 0 | Daily SMA20 | 17.4155 |
| 1 | Daily SMA50 | 17.6900 |
| 2 | Daily SMA100 | 18.0671 |
| 3 | Daily SMA200 | 18.8189 |
The previous day high was 17.2428 while the previous day low was 17.071. The daily 38.2% Fib levels comes at 17.1772, expected to provide resistance. Similarly, the daily 61.8% fib level is at 17.1367, expected to provide resistance.
Note the levels of interest below:
- Pivot support is noted at 17.1098, 17.0045, 16.938
- Pivot resistance is noted at 17.2815, 17.3481, 17.4533
| Levels | Levels.1 |
|---|---|
| Previous Daily High | 17.2428 |
| Previous Daily Low | 17.0710 |
| Previous Weekly High | 17.3353 |
| Previous Weekly Low | 17.0243 |
| Previous Monthly High | 18.0780 |
| Previous Monthly Low | 17.4203 |
| Daily Fibonacci 38.2% | 17.1772 |
| Daily Fibonacci 61.8% | 17.1367 |
| Daily Pivot Point S1 | 17.1098 |
| Daily Pivot Point S2 | 17.0045 |
| Daily Pivot Point S3 | 16.9380 |
| Daily Pivot Point R1 | 17.2815 |
| Daily Pivot Point R2 | 17.3481 |
| Daily Pivot Point R3 | 17.4533 |
[/s2If]
Nehcap Expert Advisor
The NEHCAP MT4 EA is high quality professional trading system geared to generate returns without using GRID or martingales. Each trade has strict risk per trade parameter. The pairs under management include EURUSD, GBPUSD, AUDCAD, AUDNZD,GBPAUD, EURAUD, EURCAD, CHFJPY and many more.
The system is trading live: LIVE ACCOUNT TRACKING
You can run it free. Apply for a free trial and track our account. Buy the system or use profit share mechanism to generate returns on your MT4.
Join Our Telegram Group
")


